Satellites
- The Added Value of Satellite Data
- Sentinel EO Data - SAR and Multispectral Monitoring
- Satellite Urbanization Service
- Satellite Agricolture Service
- Satellite Humidity & Irrigation Service
The Added Value of Satellite Data
Click here to download the PDF
Introduction
Welcome. Today we are going to explore one of the most important Earth observation systems currently operating in the world: the Copernicus Programme, and the family of satellites known as the Sentinel missions. The goal is to understand what Copernicus is, how its satellites work from a technological perspective, and how the data produced by these satellites can be acquired and transformed into useful services. We will focus particularly on four Sentinel missions that are fundamental for many environmental and geospatial applications: Sentinel 1, Sentinel 2, Sentinel 3 and Sentinel-5P. Each of these satellites observes the Earth in a different way, using different sensing technologies, and each captures a different physical aspect of our planet. By the end of this lesson, you should have a clear understanding of how these satellites work, how their data are accessed, and why they are such powerful tools for environmental monitoring and spatial analysis.
What is Copernicus?
Let’s begin with the big picture. Copernicus is the Earth observation component of the European Union Space Programme. Its mission is to provide accurate, timely, and reliable information about the Earth system to support environmental monitoring, climate analysis, disaster management, agriculture, urban planning, and many other domains. But Copernicus is not just a satellite programme. It is actually a complete Earth observation ecosystem. This ecosystem includes satellites in orbit, ground receiving stations, processing infrastructure, environmental models, data distribution platforms, and thematic services.
The system is implemented through collaboration between several European institutions, including the European Commission, the European Space Agency, often referred to as ESA, EUMETSAT, and the European Centre for Medium-Range Weather Forecasts, commonly abbreviated as ECMWF. Together, these institutions operate a large-scale environmental monitoring infrastructure that continuously observes our planet. One of the most important design principles of Copernicus is operational continuity. Unlike many earlier Earth observation missions that were primarily designed for scientific experiments, Copernicus satellites are built to support systematic, long-term monitoring. This means that their measurements are designed to be: repeated regularly, consistent over time and stable across decades. This operational philosophy is essential when we want to monitor processes such as climate change, land use evolution, or atmospheric pollution trends.
The Sentinel Satellites
The backbone of Copernicus is a fleet of satellites called the Sentinel missions. Each Sentinel mission is designed to measure specific properties of the Earth system. Rather than duplicating each other’s capabilities, the Sentinel satellites are complementary. Each mission uses different sensors and different measurement techniques to observe different aspects of the Earth. For example some satellites observe the Earth using radar, others use multispectral optical imaging, others measure surface temperature and others analyse atmospheric chemistry. When we combine all these measurements together, we obtain a much richer understanding of the planet than any single sensor could provide alone. In this video we will give you an introduction on four missions: Sentinel 1, Sentinel 2, Sentinel 3 and Sentinel 5P.
Sentinel-1: Radar Observation of the Earth
Let’s start with Sentinel 1. Sentinel 1 is the radar mission of Copernicus. Unlike traditional Earth observation satellites that rely on visible light, Sentinel 1 uses a technology called Synthetic Aperture Radar, often abbreviated as SAR. SAR is an active sensing system. This means the satellite emits microwave signals toward the Earth and measures the energy that is reflected back.
Because the satellite generates its own signal, Sentinel 1 does not depend on sunlight. It can observe the Earth day and night. Even more importantly, radar waves can penetrate cloud cover much more effectively than visible light. This makes Sentinel 1 extremely valuable for monitoring regions where clouds are frequent, such as tropical areas. The radar instrument onboard Sentinel 1 operates in the C-band microwave frequency range. This wavelength is particularly sensitive to surface roughness, soil moisture, vegetation structure and built infrastructure. When the radar signal interacts with the Earth’s surface, the returned signal, known as backscatter, contains information about these properties. For example Smooth surfaces such as calm water reflect radar energy away from the satellite and therefore appear dark. Rough surfaces, like urban areas with buildings and structures, reflect more energy back to the satellite and appear bright.
This property makes radar extremely useful for detecting urban areas, flooded zones, ice structures and infrastructure. But perhaps the most powerful application of Sentinel 1 comes from a technique called Interferometric SAR, or InSAR. In this technique, radar images acquired at different times are combined and compared at the level of the radar signal phase. Because the radar phase encodes distance between the satellite and the ground target, even very small changes in ground position can be detected. In favorable conditions, this technique can measure ground displacement on the order of millimeters. This allows scientists and engineers to monitor phenomena such as ground subsidence, landslides, volcanic deformation and structural movement of infrastructure. These capabilities make Sentinel 1 a critical tool for geotechnical monitoring and terrain analysis.
Sentinel-2: Multispectral Optical Observation
The next mission we will discuss is Sentinel 2. Sentinel 2 is the multispectral optical imaging mission of Copernicus. The satellite carries an instrument known as the MultiSpectral Instrument, or MSI. This instrument captures images of the Earth in 13 different spectral bands. These bands cover wavelengths in the visible spectrum, the near infrared and the short-wave infrared. Each spectral band provides different information about the physical properties of the surface. For instance, vegetation reflects strongly in the near-infrared region but absorbs strongly in the red region of the visible spectrum. This spectral behaviour is related to the internal structure of plant leaves and the presence of chlorophyll. By combining different spectral bands mathematically, scientists can derive spectral indices. One of the most famous of these is the Normalized Difference Vegetation Index, or NDVI. NDVI is widely used to assess vegetation health and biomass.
But Sentinel 2 enables many other indices as well, including NDWI for water detection, NDBI for built-up area detection, moisture indices, burn severity indices and red-edge vegetation indicators. Another key feature of Sentinel 2 is its spatial resolution. Some bands are acquired at 10 meters resolution, which is very detailed for a global Earth observation mission. This makes Sentinel 2 particularly useful for applications such as land cover classification, agriculture monitoring, forestry management and urban mapping. Because the Sentinel 2 mission uses two satellites in orbit, the revisit time is short, allowing frequent monitoring of the same location.
Sentinel-3: Monitoring Environmental and Thermal Dynamics
Next we move to Sentinel 3. Sentinel 3 is a multi-instrument mission designed to monitor the Earth system at large scale. Unlike Sentinel 1 or Sentinel 2, which focus primarily on land observations, Sentinel 3 includes instruments for both land and ocean monitoring. The satellite carries several sensors. One of the most important is the Sea and Land Surface Temperature Radiometer, abbreviated as SLSTR. This instrument measures the thermal radiation emitted by the Earth's surface. From this radiation, scientists can derive Land Surface Temperature, often abbreviated as LST. Land surface temperature is extremely important for studying climate processes, drought conditions, urban heat island effects and agricultural stress.
Sentinel 3 also carries the Ocean and Land Colour Instrument, or OLCI, which measures reflected sunlight across many spectral bands. This instrument is used to study ocean colour, vegetation, and biophysical surface properties. Another instrument onboard Sentinel 3 is the Synthetic Aperture Radar Altimeter, which measures the height of the ocean surface and other geophysical properties. Together, these instruments make Sentinel 3 an important platform for environmental monitoring. In land applications, the thermal measurements from Sentinel 3 are particularly useful for analysing heat patterns across cities and landscapes.
Sentinel-5P: Monitoring Atmospheric Composition
The final satellite we will discuss today is Sentinel 5P. This mission focuses on atmospheric chemistry. Sentinel 5P carries a single instrument called TROPOMI, which stands for Tropospheric Monitoring Instrument. TROPOMI is a spectrometer that measures sunlight reflected from the Earth's atmosphere. By analysing how this light is absorbed at different wavelengths, scientists can determine the concentration of various atmospheric gases. These include pollutants such as nitrogen dioxide, sulphur dioxide, carbon monoxide, methane and ozone. This information is essential for understanding air pollution, climate forcing, and atmospheric chemistry. Because Sentinel 5P provides global coverage with high spatial resolution, it has become one of the most important satellites for monitoring air quality worldwide.
How Copernicus Data Are Acquired
Now that we understand the satellites themselves, the next question is: How do we actually obtain their data? Copernicus data are distributed through dedicated platforms such as the Copernicus Data Space Ecosystem. Users can access satellite data through web interfaces or programmatic APIs. To obtain data, a user typically specifies the satellite mission, the geographic area of interest, the time period and the product type. The platform then provides the relevant satellite products for download. These datasets are generally distributed in standardized formats that include both the measurement data and metadata describing acquisition conditions. In many operational systems, data acquisition is automated through scripts or cloud pipelines that continuously query the catalog and download new observations.
The Copernicus Data Space Ecosystem
The Copernicus Data Space Ecosystem is the main access infrastructure for Copernicus satellite data. It is designed to provide users with a unified environment where they can search satellite data archives, visualize observations, download raw satellite products and process them in cloud-based environments. Historically, Copernicus data were distributed through several different platforms. One of the most widely known was the Copernicus Open Access Hub, also known as SciHub. However, as the Sentinel archive grew larger and larger, the need for a more scalable system became clear. Today, the Copernicus Data Space Ecosystem represents the next generation of data access infrastructure. It provides access to Sentinel 1 radar data, Sentinel 2 multispectral optical imagery, Sentinel 3 environmental monitoring data, Sentinel 5P atmospheric composition measurements and additional Copernicus datasets.
One of the defining characteristics of this ecosystem is that it integrates data discovery, visualization, and processing services into a single environment. This means users can either download raw satellite products for local processing, or, process data directly within cloud infrastructures. Let’s begin with the simplest access method: the web interface. This method is particularly useful for students, researchers or analysts and users who need to manually inspect data before downloading them. To begin using the Copernicus Data Space Ecosystem, a user first needs to create an account. This is done through the Copernicus Data Space portal. Registration is free and allows access to the satellite catalog and related services.
Once logged in, users can access the data browser interface. The data browser is essentially an interactive map that allows users to search the satellite archive. At the center of the interface is a geospatial map viewer. Users can navigate the map, zoom into regions of interest, and define their Area of Interest, often abbreviated as AOI. This area can be defined in several ways: by drawing a polygon directly on the map, selecting a rectangular bounding box, uploading a shapefile or a GeoJSON boundary, or entering geographic coordinates manually. Once the area of interest has been defined, users can apply filters to narrow down the available satellite observations. Typical filters include the satellite mission, the acquisition date, the level of cloud coverage, the product type, and the processing level.
For example, if we want to search for Sentinel 2 data over northern Italy during July 2024 with low cloud coverage, we would simply set the mission to Sentinel 2, choose the time interval from the first to the thirty-first of July 2024, and specify a cloud coverage lower than twenty percent. The interface will then query the Copernicus catalogue and display the matching observations directly on the map.
Each observation corresponds to a satellite product that includes the measurement data collected by the satellite, together with metadata describing the acquisition conditions, geolocation information, and calibration parameters. By clicking on a product footprint on the map, users can inspect its metadata. These metadata typically include information such as the acquisition timestamp, the orbit number, the satellite platform, the processing level, and the spatial resolution. Users can also preview the imagery through quick-look visualizations. This is extremely useful for evaluating whether the product is suitable for analysis before downloading it.
Once a suitable product has been identified, the user can download it directly from the interface. Downloads typically provide the data as compressed archives that contain the measurement bands, the metadata files, the quality flags, and the geolocation grids. For example, Sentinel 2 products contain multiple spectral bands stored as raster files. Sentinel 1 products contain radar backscatter measurements and related metadata. This method of downloading data through the web interface is ideal for exploratory analysis and manual workflows.
However, when working with large datasets or automated pipelines, manual downloading quickly becomes inefficient. That is where APIs come in.
Accessing Data Through APIs
An API, or Application Programming Interface, allows software programs to communicate directly with the data platform. Instead of manually searching and downloading files, a script can automatically query the Copernicus catalog and retrieve the required products. This approach is essential when building automated Earth observation pipelines. The Copernicus Data Space Ecosystem provides APIs based on standard web protocols. Most queries are performed using HTTP requests. In practice, this means that programming languages such as Python, JavaScript, or Java can interact directly with the satellite catalog. Let’s look at a simple conceptual example. Suppose we want to retrieve Sentinel-2 imagery over a specific region. Using an API query, we specify parameters such as satellite mission, time interval, and geographic bounding box.
In Python, a request might look conceptually like this:
import requests
url = "https://catalogue.dataspace.copernicus.eu/odata/v1/Products"
params = {
"$filter": "Collection/Name eq 'SENTINEL-2' and ContentDate/Start ge 2024-01-01T00:00:00Z"
}
response = requests.get(url, params=params)
print(response.json())
This request queries the product catalog and returns a list of matching satellite observations. Each observation includes metadata describing the dataset. Once we obtain the product identifier, we can construct a download request. Another example might involve filtering by geographic coordinates. In that case, the query includes a spatial filter describing the area of interest. The API returns only products intersecting that region. This is particularly useful when building services that monitor a fixed geographic area over time.
Automating Data Pipelines
In many operational systems, API access is combined with automated processing workflows. For example, an environmental monitoring system may run a sequence of operations every day. It first queries the Copernicus catalog to check whether new Sentinel observations are available over the area of interest. It then downloads the relevant products and proceeds with data preprocessing, which can include operations such as atmospheric correction, geometric correction, reprojection, and the conversion of the data into analysis-ready formats. Once the data have been prepared, the system runs analytical algorithms that can generate outputs such as vegetation indices, land classification maps, temperature anomaly detection, or air quality indicators. Finally, the results are stored in a database or displayed in dashboards.
By automating the data acquisition stage using APIs, the entire processing chain can operate continuously without manual intervention. This is the basis of many modern Earth observation services.
Authentication and Access Tokens
When using APIs, authentication is usually required. The Copernicus Data Space Ecosystem typically uses authentication tokens. After logging in through the portal, users can obtain credentials that allow their scripts to access the API. In practice, this means that before querying the catalog, the script performs a login request. The platform returns an authentication token. This token is then included in subsequent API requests. This ensures that only registered users access the infrastructure while still maintaining the open-data policy.
Advantages of API-Based Access
API access provides several important advantages compared with manual downloading. First of all, it enables automation. Instead of manually searching for satellite products every day, scripts can perform the same task automatically. It also allows scalability, because large datasets can be retrieved programmatically across many regions or time intervals. In addition, APIs make it possible to integrate satellite data with other systems, such as geospatial databases, cloud processing platforms, or machine learning pipelines. This is why most modern Earth observation services rely heavily on API-based data acquisition.
Combining Web and API Access
In practice, both access methods are useful. The web interface is particularly effective for exploring datasets, visualizing imagery, and manually inspecting observations. The API approach, on the other hand, is more suitable for automated workflows, large-scale data processing, and operational services. Many Earth observation projects actually use both methods. Analysts first explore data through the browser interface. Once the appropriate datasets and parameters are understood, the workflow is automated through APIs.
Data Licensing and Open Access
One of the most remarkable aspects of Copernicus is its open data policy. The European Union has adopted a free, full, and open access principle for Copernicus Sentinel data. This means that anyone can access and use the data, including researchers, students, public institutions, and commercial companies. Users are generally required only to comply with the legal notice and attribution conditions. This open data model has been extremely important for innovation.
It has allowed universities, startups, and industry to build new services based on the same publicly available data foundation.
Processing Copernicus Sentinel Data: From Raw Files to Scientific Analysis
We will move from data acquisition to the next critical stage in Earth observation workflows: data processing. In previous discussions we explored how satellite data from the Copernicus programme can be accessed through platforms such as the Copernicus Data Space Ecosystem, either through web interfaces or programmatic APIs. Once the data are downloaded, the next step is to transform those raw satellite products into meaningful information.
This is where geospatial analysis tools, remote sensing techniques, and data processing libraries come into play. In this video we will discuss how Copernicus data can be processed after download, focusing on three main aspects: First, how satellite data are stored and structured, particularly in GeoTIFF raster formats. Second, how those raster datasets can be analyzed using geospatial desktop software, such as QGIS. Third, how the same datasets can be processed programmatically using Python libraries designed for geospatial and raster analysis.
Finally, we will look at how pixel-level data and metadata describe the physical meaning of the satellite measurements.
The Structure of Copernicus Satellite Products
When we download Copernicus Sentinel data, we are not simply downloading a single image file. Instead, we receive a satellite product package. This package usually contains several components, including raster measurement files, metadata descriptions, quality information, calibration parameters, and geolocation grids. Many of the measurement layers are stored in GeoTIFF format.
A GeoTIFF is a raster image format that contains both the image data and the geospatial information required to place that image correctly on the Earth's surface. Unlike a simple photograph, a GeoTIFF includes metadata that describe the geographic coordinate system, the spatial resolution, the projection information, the pixel size, and the spatial extent. This allows geospatial software to correctly interpret the dataset. Each pixel in a GeoTIFF corresponds to a precise location on the Earth. For example, in Sentinel-2 imagery with a resolution of 10 meters, each pixel represents a 10 meter by 10 meter area on the ground.
This property allows satellite data to be analyzed spatially at very high resolution.
Inspecting Satellite Data with QGIS
One of the simplest ways to explore Copernicus data is through QGIS. QGIS is a free and open-source geographic information system that supports many raster and vector formats, including GeoTIFF. Because it is widely used in academia and industry, QGIS is an excellent tool for students learning remote sensing. When a GeoTIFF file is loaded into QGIS, the software reads the geospatial metadata and places the raster correctly on the map. From there, users can visualize the data in several ways.
For optical imagery, such as Sentinel-2 data, different spectral bands can be combined to produce natural color or false color composites. For example, a natural color composite is created by mapping the red band to the red channel, the green band to the green channel, and the blue band to the blue channel. Alternatively, a false color composite may use the near infrared, red, and green bands. This type of visualization highlights vegetation and other surface features. Beyond simple visualization, QGIS allows users to examine the dataset pixel by pixel.
By activating the pixel inspector tool, users can click on any location in the image and see the numeric value stored in that pixel. These values correspond to physical measurements recorded by the satellite sensor. For instance, in optical data these numbers often represent reflectance values scaled into digital numbers. In radar datasets they represent backscatter intensity. This pixel-level access allows researchers to directly analyze the underlying measurements rather than relying only on visual interpretation. QGIS also provides tools for raster analysis. Users can compute raster algebra expressions to create derived layers. For example, calculating vegetation indices such as NDVI requires combining two spectral bands using a mathematical formula. This can be done directly in QGIS using the raster calculator.
Processing Satellite Data with Python
While desktop GIS tools are useful for exploration and visualization, large-scale Earth observation analysis often requires automated processing.
This is where Python-based geospatial libraries become extremely useful. Python has become one of the most widely used languages in remote sensing because of its rich ecosystem of scientific libraries. Some of the most important libraries for raster analysis include GDAL, Rasterio, NumPy, xarray, rioxarray and GeoPandas. These libraries allow developers to open GeoTIFF files, manipulate raster data, and perform advanced spatial analysis. For example, using Python we can open a GeoTIFF file and read its pixel values.
A simplified example using Rasterio might look like this:
import rasterio
with rasterio.open("sentinel2_band4.tif") as dataset:
band = dataset.read(1)
print(band.shape)
This code loads the raster and reads the pixel values into a numerical array.
Once the data are in a NumPy array, we can perform mathematical operations directly on the pixels. For example, computing NDVI from Sentinel-2 bands:
ndvi = (nir - red) / (nir + red)
Where nir is the near-infrared band, and red is the red band. The result is a new raster where each pixel represents the vegetation index for that location. This approach allows large datasets to be processed automatically across many satellite scenes.
Understanding Metadata
A crucial aspect of satellite data processing is understanding metadata. Metadata are structured descriptions that explain how the data were acquired and how they should be interpreted. Without metadata, the raw pixel values would have little meaning. Typical metadata fields include information such as the acquisition time, which indicates when the satellite captured the image, as well as the satellite platform and the sensor used to collect the data.
They also describe the spatial resolution, meaning the ground size represented by each pixel, and the coordinate reference system, which defines how geographic coordinates are represented. Finally, metadata indicate the processing level of the product, since satellite datasets are often distributed in different processing stages. For example, Sentinel 2 Level-1C products contain top-of-atmosphere reflectance, while Level-2A products include atmospheric correction. Metadata are typically stored in XML or JSON files within the product package. These files provide detailed information required to correctly interpret the data. For scientific analysis, reading and understanding metadata is essential.
Pixel-Level Interpretation for Each Sentinel Mission
Let us now examine what the pixel values actually represent for different Sentinel missions. Each satellite measures a different physical quantity. Therefore, the pixel values have different meanings depending on the dataset.
Sentinel 1 uses Synthetic Aperture Radar. In Sentinel 1 GeoTIFF products, pixel values typically represent radar backscatter intensity, which measures how much of the radar signal is reflected back toward the satellite.
This value depends on several physical factors. One of them is surface roughness, because rough surfaces tend to scatter radar waves more strongly. Another important factor is moisture content, since wet soils reflect radar signals differently from dry soils. Surface geometry also plays a role, as structures such as buildings can produce strong radar reflections. Radar products are often expressed as sigma naught values, usually converted into a decibel scale. Higher values correspond to stronger radar reflections. These measurements allow analysis of terrain structure, flooding, vegetation structure, and infrastructure.
Sentinel 2 pixel values represent spectral reflectance. Each band corresponds to a different wavelength range of reflected sunlight. The pixel value indicates how much light was reflected by the surface in that spectral band. These reflectance values are typically stored as scaled integers. To obtain physical reflectance values, scaling factors must be applied. Once converted, the values can be used to compute spectral indices. For example High NDVI values correspond to healthy vegetation. Low NDVI values correspond to bare soil or built surfaces. Water bodies usually produce distinct spectral signatures. Because Sentinel 2 includes 13 spectral bands, each pixel contains multiple measurements describing the same location across different wavelengths.
Sentinel 3 includes thermal and environmental sensors. For many land applications, the most relevant product is Land Surface Temperature. In this case, pixel values correspond to temperature measurements derived from thermal infrared observations. These values are usually expressed in Kelvin. Temperature products allow scientists to study heat islands, drought stress, evapotranspiration patterns, and climate dynamics. Because Sentinel 3 has coarser spatial resolution than Sentinel 2, its pixels represent larger ground areas, but provide important environmental information.
Sentinel 5P measures atmospheric composition. Its pixel values correspond to trace gas concentrations retrieved from spectral analysis. These may include measurements of nitrogen dioxide, methane, carbon monoxide, and ozone. The values are typically expressed as column densities, representing the amount of gas present in a vertical column of atmosphere above a given location. These data are extremely valuable for air quality monitoring and environmental analysis.
From Raw Data to Analytical Products
Once pixel values are correctly interpreted and processed, satellite datasets can be transformed into higher-level analytical products. Examples include vegetation health maps, land classification layers, temperature anomaly detection, and air pollution monitoring. These products are generated by combining multiple raster layers and applying scientific models. The resulting datasets can then be integrated into geographic information systems, decision support platforms, or environmental monitoring dashboards.
To conclude, the Copernicus programme represents one of the most advanced Earth observation infrastructures ever developed. Through the Sentinel missions, it provides continuous, systematic monitoring of our planet using multiple sensing technologies. Sentinel-1 observes the Earth with radar, enabling all-weather terrain monitoring and deformation analysis. Sentinel-2 provides high-resolution multispectral imagery for land cover, vegetation, and environmental monitoring.
Sentinel-3 measures environmental dynamics, including land surface temperature. Sentinel-5P analyzes atmospheric composition and air quality. Together, these missions create a powerful system for understanding the Earth and supporting environmental decision-making. For scientists, engineers, and students in STEM fields, Copernicus offers an extraordinary opportunity. It provides open access to one of the richest environmental datasets ever collected. And it allows us to transform satellite measurements into knowledge about our planet.
Understanding how to use these data effectively is one of the key skills for the next generation of geospatial scientists and environmental engineers. Processing Copernicus data is a powerful example of how raw satellite measurements can be transformed into meaningful environmental information. Through tools such as QGIS and Python geospatial libraries, researchers and engineers can inspect satellite data pixel by pixel and derive valuable insights. Understanding raster formats, metadata structures, and pixel-level measurements is essential for anyone working in Earth observation. And with the open data policy of Copernicus, these datasets are available to students, scientists, and developers around the world. Learning how to process them effectively is therefore a key skill in modern geospatial science.
Automatic Integration of Sentinel in EagleArca
I will present now the satellite services developed in the EagleArca context, with a particular focus on the Copernicus ecosystem and on the Sentinel missions that make these services possible. The objective is to explain not only what these satellites are, but also how their data can be transformed into concrete operational services for environmental monitoring, urban analysis, agriculture, terrain assessment, atmospheric quality monitoring, and weather-aware decision support.
To understand EagleArca’s service architecture, we first need to understand the logic of the Copernicus programme. Copernicus is the European Union’s Earth observation framework, implemented with the support of ESA, EUMETSAT, ECMWF and other institutional partners. Its design principle is extremely important: it is not only a satellite programme, but a full operational ecosystem that couples spaceborne observations with ground segments, processing chains, and thematic services for land, ocean, atmosphere, climate, and emergency management. The Sentinel satellites were designed specifically to provide robust, repeatable, operational data streams for this ecosystem, with constellations and revisit strategies chosen to support systematic monitoring rather than isolated acquisitions.
Within this framework, EagleArca uses multiple Sentinel missions because no single sensor is sufficient to describe the complexity of the Earth system. Optical imagery, radar backscatter, thermal observations, topographic inference, atmospheric chemistry, and meteorological or climate context all capture different physical aspects of the same territory. The real power lies in fusion: combining complementary measurements into a coherent analytical layer over a given Area of Interest, or AOI.
Let us begin with Sentinel-1, because it is foundational for all-weather terrain and deformation analysis. Sentinel-1 is a radar mission based on a C-band Synthetic Aperture Radar, often abbreviated as C-SAR. The defining strength of SAR is that it is an active sensor: instead of waiting for sunlight reflected from the surface, it transmits microwave pulses and measures the backscattered signal. This makes it usable both day and night, and, unlike optical instruments, it is far less sensitive to cloud cover. That is why Sentinel-1 is so important for persistent operational monitoring. ESA describes the mission as an all-weather, day-and-night imaging system, and the satellites carry a C-band SAR instrument specifically for this purpose.
From a physics perspective, Sentinel-1 measures the interaction between the emitted microwave signal and the geometry, roughness, moisture content, and dielectric properties of the Earth surface. This means that Sentinel-1 is not simply producing “images” in the visual sense. It is measuring radar response. Smooth water surfaces tend to behave differently from rough urban areas. Wet soils respond differently from dry soils. Artificial structures produce characteristic high-backscatter patterns. This is why Sentinel-1 is so valuable for land deformation, flood mapping, surface roughness characterization, and infrastructure monitoring.
For EagleArca, Sentinel-1 supports several important base services. One is terrain morphology analysis. Even though Sentinel-1 is not a classical optical stereo mapping mission, radar-derived methods and interferometric approaches can support the reconstruction of terrain-related information and, in specific processing contexts, the derivation of DEM products, meaning Digital Elevation Models. A DEM is a mathematical representation of terrain elevation over space. Once a DEM is available, further topographic descriptors can be computed: slope, aspect, local relief, watershed accumulation, and terrain-derived constraints relevant for hydrology, infrastructure planning, and agricultural suitability.
A second major service enabled by Sentinel-1 is subsidence analysis. This is based on interferometric SAR processing, where repeated radar acquisitions over the same area are compared in phase. The phase of the radar signal contains information on the distance between the satellite and the target. By examining phase evolution over time, it is possible to estimate very small surface displacements, often at millimetric scale under favourable conditions. This is the basis of ground deformation monitoring. Subsidence, for example, may reveal aquifer depletion, soil consolidation, infrastructure stress, mining-related deformation, or long-term urban stability issues. Closely related is the broader phase displacement over time analysis, which is not limited to vertical subsidence alone, but can be used to characterize temporal deformation signals and changes in stable scatterers across the AOI.
These radar-based capabilities are among the most technically sophisticated elements in the EagleArca portfolio because they transform repeated remote sensing acquisitions into a time-resolved geophysical measurement.
Now let us turn to Sentinel-2, which is in many ways the workhorse of land optical observation. Sentinel-2 is a twin-satellite mission carrying the MultiSpectral Instrument, or MSI. This is a wide-swath, high-resolution optical imager that samples the Earth in 13 spectral bands distributed across the visible, near-infrared, and short-wave infrared parts of the spectrum. The spatial resolutions differ by band: some are acquired at 10 m, some at 20 m, and some at 60 m. The wide swath and multispectral design make Sentinel-2 especially suited for land applications, including vegetation monitoring, land cover mapping, soil and water observation, and coastal or inland water analysis.
The key concept here is that Sentinel-2 does not merely provide color pictures. Each spectral band is sensitive to different physical properties of surface materials. Vegetation, for example, strongly absorbs red light due to chlorophyll but reflects strongly in the near infrared because of leaf internal structure. Water absorbs strongly in parts of the infrared. Bare soil, urban materials, and stressed vegetation all exhibit distinct spectral signatures. Once these bands are combined mathematically, we can compute indices such as NDVI, NDWI, NDBI, red-edge indices, burn indices, moisture indices, and many others. These indices are not arbitrary formulas; they are physically motivated transformations that emphasize a specific phenomenon, such as vegetation vigor, built-up areas, water presence, or soil condition.
EagleArca uses Sentinel-2 as the basis for Classification and Superclassification services. In practical terms, over the selected AOI, all relevant Sentinel-2 scenes are downloaded, preprocessed, and harmonized. Then a classification workflow is applied to separate land cover or land use categories. At a basic level, this may mean distinguishing vegetation, bare soil, water, and built-up surfaces. At a more advanced level, through what we can call superclassification, the service may produce a more detailed semantic partition of the territory, for example differentiating agricultural typologies, urban fabrics, industrial surfaces, tree-dominated zones, low vegetation, or transitional areas. Super-resolution enhancement, when available in the EagleArca pipeline, increases the spatial interpretability of some structures, improving object delineation and the readability of fine patterns.
The result is not just a thematic map, but a structured spatial interpretation of the AOI derived from multispectral evidence.
This is a good point to emphasize an operational detail about EagleArca’s approach. For the one-time services based on static or slowly varying spatial characterization, the platform does not rely on a single image snapshot. Instead, over the AOI, it downloads and consolidates all the relevant data for the Sentinel missions involved in that specific service. In the case of classification, that means collecting the Sentinel-2 archive needed to build a robust representation of the observed surface, minimizing cloud contamination and maximizing seasonal interpretability. This is essential because the quality of any classification depends strongly on temporal representativeness and preprocessing rigor.
Let us now consider Sentinel-3, which is often less familiar to non-specialists, but is extremely important in environmental monitoring. Sentinel-3 is a more multi-instrument mission. Its payload includes OLCI, the Ocean and Land Colour Instrument; SLSTR, the Sea and Land Surface Temperature Radiometer; SRAL, the Synthetic Aperture Radar Altimeter; and MWR, the Microwave Radiometer. ESA and Copernicus documentation consistently identify these as the core Sentinel-3 instruments.
Each of these sensors contributes a different physical capability. OLCI is a spectrometer optimized for ocean and land color applications, useful for water quality, vegetation, and surface characterization. SLSTR is fundamental for temperature retrieval, especially Land Surface Temperature, which is central for thermal studies. SRAL and MWR support altimetric and geophysical measurements, particularly relevant over oceans, inland waters, and broader Earth system monitoring.
In the EagleArca service stack, the most immediately relevant Sentinel-3 capability is the Heat Island analysis. Here the key variable is surface temperature, monitored over time. The urban heat island effect is the tendency of urban areas to exhibit higher temperatures than surrounding rural or less built-up areas due to altered surface materials, reduced evapotranspiration, anthropogenic heat release, and modified urban geometry. With Sentinel-3 temperature observations, EagleArca can evaluate the spatial and temporal thermal behavior of the AOI. This is particularly valuable for urban planning, public health risk assessment, climate adaptation, and infrastructure resilience. A heat island service is therefore not only a temperature map; it is a physically meaningful diagnostic of how the built environment interacts with radiation balance, heat storage, and local climate forcing.
Next we come to Sentinel-5P, where the “P” stands for Precursor. Sentinel-5P is dedicated to atmospheric composition monitoring and carries one highly advanced payload: TROPOMI, the TROPOspheric Monitoring Instrument. The mission’s objective is to measure atmospheric variables with high spatial and temporal resolution in support of air quality, climate forcing, ozone monitoring, and UV-related applications. Copernicus and ESA sources explicitly describe TROPOMI as the instrument onboard Sentinel-5P and emphasize its relevance for monitoring gases and aerosols in the atmosphere.
From an application standpoint, Sentinel-5P is crucial for retrieving variables such as nitrogen dioxide, sulfur dioxide, carbon monoxide, ozone, formaldehyde, methane, and aerosol-related information, depending on the processing stream. This makes it a cornerstone for Air Quality services. In EagleArca, the air quality workflow is updated daily and is based primarily on Sentinel-5P together with atmospheric service layers, especially those associated with Copernicus Atmosphere products. In operational terms, satellite observations alone are powerful, but atmospheric composition services increase their utility by integrating retrievals, models, and assimilation frameworks into consistent geophysical products. This allows air quality assessment to be more continuous, more interpretable, and more immediately actionable than a satellite-only view would be.
The same operational philosophy applies to the Weather service. Here it is important to clarify terminology. The European service the user refers to as “ECMWF” is best understood in the Copernicus and ECMWF context as the broader family of European atmospheric and climate services, notably those connected with ECMWF, Copernicus Atmosphere Monitoring Service, and Copernicus Climate Change Service. These products are not identical to the Sentinel missions, because they include modeling, assimilation, and forecast components. For EagleArca, this is extremely valuable: while Sentinel satellites observe the Earth, weather and climate services provide dynamic context and forecast capability. Therefore the Weather service is not just a snapshot of atmospheric conditions, but a temporal interpretation that includes forecasts, synoptic patterns, and evolving meteorological scenarios.
This is critical for environmental management, agricultural planning, risk anticipation, and operational readiness.
Let us now summarize how EagleArca organizes these inputs into actual services over an AOI. For one-time analytical services, EagleArca first identifies the Area of Interest and then downloads all the relevant satellite data needed from the available Sentinel missions. This creates a consolidated data foundation for the requested analyses. On this basis, it delivers Classification and Superclassification, based primarily on Sentinel-2 multispectral data and enhanced through super-resolution and advanced thematic interpretation. Heat Island analysis, based on Sentinel-3 temperature products, especially the temporal analysis of land surface temperature behavior. Terrain morphology, subsidence, and DEM analysis, based on Sentinel 1 radar acquisitions and interferometric processing for deformation and morphology-related outputs.
These are called one-time services not because the satellite archive is static, but because the analytical package is generated as a targeted assessment over the AOI rather than as a continuously refreshed daily feed.
In addition, EagleArca provides daily updated services, which are particularly relevant when the variable of interest evolves quickly and operationally. These include Air Quality, based mainly on Sentinel-5P atmospheric composition products integrated with atmosphere services. Weather, based on European atmospheric and forecasting services that provide both observed-state interpretation and forecast capability. This distinction between one-time and continuously updated services is conceptually important. Some environmental variables, such as land cover or topography, change relatively slowly and are best addressed through high-quality analytical campaigns. Others, such as atmospheric chemistry and weather, are dynamic by nature and therefore require continuous updates. From these base services, EagleArca derives two higher-level thematic products: Urbanization and Agriculture.
The Urbanization service is not merely a map of buildings. It is a synthetic assessment of the urban environment derived from multiple satellite dimensions. Sentinel-2 classification identifies built-up areas, impervious surfaces, vegetation loss, and spatial expansion patterns. Sentinel-3 temperature layers add the thermal dimension, revealing urban heat island behavior and hotspots of thermal stress. Sentinel-1 subsidence and deformation analysis adds geotechnical awareness, identifying areas where the built environment may be affected by surface movement or structural instability. Air quality layers, informed by Sentinel-5P and atmospheric services, enrich the evaluation by adding an environmental health perspective. In this way, Urbanization becomes a multi-layer service that supports urban planning, resilience studies, infrastructure monitoring, climate adaptation, and livability assessment.
The Agriculture service follows a similar integrative philosophy but is tuned to rural and agro-environmental processes. Sentinel-2 provides crop-related spectral information, vegetation indices, and classification layers that support crop vigor monitoring, field characterization, and seasonal interpretation. Sentinel-3 temperature products help assess thermal stress and surface energy balance. Weather and climate services contribute rainfall context, drought indicators, and forecast support. Sentinel-1 can add information about surface structure, moisture-related behavior, and terrain constraints, while DEM products help understand drainage, slope, and field suitability. Atmospheric quality layers can even support analysis of pollutant exposure or broader environmental stress. Thus, Agriculture is not limited to crop mapping; it becomes a decision-support framework for productivity, environmental conditions, and land management.
At this point, it is worth stepping back and asking a broader scientific question: why are satellite data so powerful in the first place? The first answer is synopticity. Satellites can observe large areas coherently, with repeatable acquisition geometries and systematic revisit schedules. This is crucial when the objective is not merely to inspect one location, but to compare patterns across a city, a region, or an agricultural district. The second answer is multidimensionality. Different sensors observe different physical variables: reflectance, backscatter, thermal emission, atmospheric absorption, deformation, altitude-related geometry and modeled meteorological conditions. This allows us to characterize the same AOI from multiple physical perspectives. The third answer is time. Satellite archives are not just spatial datasets, they are temporal datasets.
This means that we can monitor trends, detect anomalies, characterize seasonality, and build predictive or diagnostic indicators. Time-series analysis is one of the central scientific advantages of modern Earth observation.
However, satellite data also have limits. Their interpretation depends on resolution, revisit time, atmospheric conditions, sensor geometry, and algorithmic assumptions. For this reason, one of the most powerful evolutions of Earth observation is the integration of satellite data with in situ sensor networks. Ground-based weather stations, soil moisture probes, air quality stations, hydrological sensors, structural monitoring systems, IoT devices, and field measurements can all complement satellite observations.
This integration is not merely additive, it is synergistic. Ground sensors provide local accuracy, physical validation, and high-frequency measurement at specific points. Satellites provide spatial continuity, large-scale context and temporal consistency over broad areas. When these two sources are fused, the result is a more complete and reliable representation of the system being studied. In urban contexts, for example, in situ temperature and pollution sensors can validate and refine satellite-based heat island and air quality indicators. In agriculture, soil probes, weather stations, and field observations can calibrate vegetation and moisture models. In geotechnical monitoring, ground instrumentation can be combined with Sentinel 1 deformation products to strengthen risk interpretation.
So the real promise of services such as EagleArca is not simply that they use satellite data The real promise is that they transform remote sensing into a structured analytical framework. They begin with a carefully defined AOI. They acquire and preprocess all relevant Sentinel data. They build physically meaningful products such as classification, thermal diagnostics, terrain morphology, deformation, air quality, and weather context. hen they combine these layers into higher-level thematic services such as Urbanization and Agriculture. Finally, these outputs can be further enriched by integration with sensor networks and local domain knowledge.
For a STEM audience, this is perhaps the most important conceptual takeaway: Earth observation is no longer just about imagery. It is about measurement, fusion, inference, and decision support. Sentinel 1 provides radar-based structural and deformation intelligence. Sentinel 2 provides multispectral optical intelligence for land and vegetation. Sentinel 3 provides thermal and environmental system intelligence. Sentinel 5P provides atmospheric composition intelligence. Weather and atmospheric services add forecast and modeled context. EagleArca operationalizes this ecosystem into a coherent service portfolio.
In conclusion, the Copernicus Sentinel missions represent a highly complementary set of observing systems, each designed around a distinct sensing principle and application domain. EagleArca leverages these differences rather than treating them separately. The result is a modular but integrated framework in which one-time services such as Classification, Superclassification, Heat Island, and Terrain Morphology coexist with daily updated services such as Air Quality and Weather. On top of these, the derived Urbanization and Agriculture products provide thematic interpretation for two of the most strategically important domains in environmental and territorial analysis.
This is exactly where modern geospatial intelligence is heading: away from isolated maps, and toward persistent, multi-sensor, multi-temporal, physically interpretable digital knowledge of the Earth system. And when satellite data are integrated with ground truth, field instrumentation, and expert interpretation, that knowledge becomes even more robust, more local, and more actionable.
Integrating Heterogeneous Geospatial Data
We will explore now one of the most powerful concepts in modern geospatial analysis: the integration and spatial overlay of heterogeneous datasets. In previous discussions we focused on individual data sources, such as satellite observations from the Copernicus programme. We examined how satellites like Sentinel 1, Sentinel 2, Sentinel 3, and Sentinel 5P measure different aspects of the Earth system, including surface structure, spectral reflectance, thermal dynamics, and atmospheric composition. However, the true analytical power of these data does not come from analysing them individually.
Instead, it comes from combining them spatially, layering different datasets on top of one another, and extracting patterns that emerge only when multiple sources of information are analyzed together. This process is often referred to as data fusion, layer overlay, or multisource geospatial integration. Platforms such as EagleArca, as well as other GIS-based systems, provide the capability to integrate multiple geospatial datasets into a common spatial framework. This allows analysts to compare different environmental variables across the same geographic coordinates and extract insights that would be impossible to derive from a single dataset. In today’s video we will explore how this integration works and why it is so powerful.
The Concept of Spatial Layer Overlay
In Geographic Information Systems, data are typically organized as layers. Each layer represents a specific type of information about the Earth’s surface. For example, a layer may represent elevation models, land cover classification, soil properties, surface temperature, atmospheric composition, or infrastructure maps. Each layer is georeferenced, meaning that every pixel or feature corresponds to a precise geographic location. Because of this common spatial reference, different layers can be stacked and analysed together.
This capability forms the foundation of spatial intelligence. When multiple datasets are aligned spatially, analysts can ask complex questions such as: How does terrain morphology influence flood risk? How do temperature patterns correlate with urban density? And how does vegetation health respond to soil moisture and rainfall? These questions require combining multiple layers of environmental information.
Example: Flood Risk and Terrain Stability
Let us examine a concrete example. Suppose we want to assess whether a particular area is vulnerable to flooding during heavy rainfall. Several datasets become relevant. First, we might analyse a Digital Elevation Model, or DEM. A DEM describes the topography of the terrain and allows us to calculate slope, drainage patterns, and water flow accumulation. Second, we might analyse subsidence data derived from Sentinel 1 interferometric radar measurements. Subsidence indicates whether the ground is slowly sinking over time, which may increase flood risk. Third, we might examine soil permeability or infiltration capacity. Permeability determines how easily water can infiltrate the soil. Low permeability soils tend to generate surface runoff rather than absorbing water. Individually, each of these datasets provides partial information.
But when they are combined spatially, they can reveal much deeper insights. For example: An area that exhibits low elevation, ongoing subsidence, and low soil permeability may be particularly vulnerable to flooding. In contrast, an area with higher elevation, stable ground, and permeable soil may be significantly less vulnerable. By overlaying these layers in a GIS platform, analysts can create risk maps that identify critical zones where infrastructure or populations may be exposed to environmental hazards. This is a powerful example of how integrating multiple geospatial layers leads to a more holistic understanding of the environment.
Urban Planning and Infrastructure Monitoring
Another important use case involves urban planning. Cities are complex system where environmental conditions, infrastructure and human activities interact continuously. Satellite data can provide several relevant layers. For example Sentinel 2 imagery can be used to map urban expansion and land use patterns. Sentinel 3 thermal observations can identify urbanheat islands, where built environments trap heat and create localized temperature increases.
Sentinel 1 radar measurements can reveal ground deformation, which may affect buildings, roads, and underground infrastructure. When these datasets are integrated in a GIS environment, planners can analyse relationships between urbanization, environmental conditions, and infrastructure stability. For example, they may discover that areas with intense urban density also exhibit strong heat island effects and reduced vegetation coverage. Such insights are critical for designing greener and more resilient cities.
Agricultural Monitoring
Agriculture is another domain where layered data analysis provides significant benefits. Agricultural systems depend on many interacting variables, including soil conditions, terrain morphology, vegetation health, climate patterns, and water availability. Satellite observations provide valuable inputs for several of these variables. Sentinel 2 multispectral imagery allows the calculation of vegetation indices such as NDVI, which indicate crop vigour.
Sentinel 3 thermal measurements provide information about land surface temperature and potential crop stress. Radar observations from Sentinel 1 can reveal soil moisture proxies and surface structure. When these layers are combined with terrain models and rainfall data, analysts can build comprehensive models of agricultural productivity and risk. For example, a region with declining vegetation indices, increasing temperature stress, and poor soil moisture retention may indicate a developing drought situation. Such insights allow agricultural managers to respond proactively.
Environmental Monitoring and Ecosystem Analysis
Layer integration is also essential for environmental monitoring. Ecosystems are complex and dynamic systems influenced by many interacting environmental variables. For example, forest health may depend on factors such as vegetation density, temperature anomalies, soil moisture, and atmospheric pollution. Satellite data provide measurements for many of these variables. Sentinel 2 imagery allows monitoring of vegetation density and canopy conditions. Sentinel 3 thermal sensors can detect temperature stress. Sentinel 5P atmospheric sensors provide measurements of pollutants such as nitrogen dioxide and ozone. By overlaying these datasets, researchers can study how environmental stressors interact and affect ecosystems. This integrated perspective is particularly important for climate change research and biodiversity monitoring.
Disaster Risk Assessment
Another critical application of multi-layer geospatial analysis is disaster risk assessment. Natural hazards rarely depend on a single environmental factor. Instead, they arise from combinations of conditions. For example: Flood risk depends on rainfall intensity, terrain morphology, drainage capacity, soil permeability, and urban infrastructure. Landslide risk depends on slope, soil composition, rainfall, vegetation coverage, and ground stability. By combining satellite-derived layers with environmental models, GIS platforms can produce hazard susceptibility maps that support emergency planning and disaster mitigation.
Integrating Satellite and Non-Satellite Data
So far we have focused primarily on satellite observations. However, the power of geospatial integration becomes even greater when satellite data are combined with non-satellite data sources. Two particularly important sources are drone imagery and IoT sensor networks.
High-Resolution Drone Imagery
Drones provide extremely high spatial resolution imagery. While satellites typically observe the Earth at resolutions ranging from several meters to hundreds of meters, drone cameras can capture imagery at centimetre-level resolution. This makes drone imagery particularly useful for detailed local surveys. For example, drone flights can capture building structures, agricultural field conditions, infrastructure damage, and erosion patterns. When drone imagery is integrated into a GIS platform alongside satellite datasets, it provides a multi-scale perspective. Satellite data provide broad regional coverage, while drones provide detailed local insights. This combination is particularly valuable for applications such as infrastructure inspection, agriculture monitoring, and disaster response.
IoT Sensor Networks
Another powerful complementary data source is Internet of Things sensor networks. IoT devices can measure environmental variables directly on the ground, including parameters such as soil moisture, rainfall, air quality, temperature, and water levels. Unlike satellites, which observe large areas from space, IoT sensors provide point-based measurements with high temporal frequency.
For example, a weather station may record rainfall every few minutes. By integrating these ground measurements with satellite observations, analysts can validate and refine satellite-derived models. For instance, soil moisture sensors can be used to calibrate radar-based moisture proxies derived from Sentinel 1. Air quality sensors can validate atmospheric pollution measurements from Sentinel 5P. This integration significantly improves the reliability of environmental monitoring systems.
Toward Holistic Geospatial Intelligence
When satellite observations, drone imagery, and ground sensors are combined, the result is a much richer representation of the Earth system. Each source provides different strengths. Satellites offer global coverage, consistent monitoring, and multi-spectral and multi-physical observations. Drones provide extremely high spatial resolution, flexible deployment, and detailed local inspection. IoT sensors, on the other hand, deliver direct physical measurements, high temporal resolution, and ground truth validation. Together, these data sources create what we might call holistic geospatial intelligence. This integrated approach enables more accurate environmental assessments, better risk management, and more informed decision making.
Modern GIS platforms, including EagleArca and other spatial analysis systems, make it possible to integrate heterogeneous datasets within a common geospatial framework. By overlaying multiple layers of satellite observations and ground-based measurements, analysts can uncover relationships that would otherwise remain hidden. This capability is transforming fields such as environmental monitoring, urban planning, agriculture, and disaster risk management. For students and professionals working in geospatial science, learning how to integrate heterogeneous spatial data is therefore one of the most valuable skills in the field. The future of Earth observation will not rely on a single data source. Instead, it will rely on the fusion of multiple observation systems, working together to create a deeper and more comprehensive understanding of our planet.
The Future of Environmental Monitoring and Decision Support
We explore now how advances in artificial intelligence, sensor integration, and digital twin technologies are transforming not only manufacturing systems, but also environmental monitoring and decision-support capabilities. At the heart of this transformation lies a fundamental shift: the ability to move from reactive observation of environmental conditions to predictive and adaptive management of environmental systems. Modern environmental monitoring traditionally relies on periodic measurements, manual data collection, and fragmented sensor networks. These systems provide valuable data, but they often lack the ability to interpret complex environmental dynamics in real time. As a result, environmental risks, such as pollution events, ecosystem stress, or resource inefficiencies, are frequently identified only after they have already produced measurable impacts.
This is where AI-driven monitoring architectures and digital twin frameworks can significantly change the paradigm. The first enabling element is advanced environmental perception. By deploying distributed sensing systems, including environmental sensors, remote sensing devices, camera systems, and machine-generated data streams, it becomes possible to continuously observe environmental conditions at multiple spatial and temporal scales. These sensors may measure parameters such as temperature, humidity, particulate concentration, atmospheric composition, water quality indicators, or energy consumption patterns.
However, the real value does not lie only in collecting data. The key challenge is transforming raw environmental signals into actionable knowledge. Artificial intelligence plays a crucial role in this transformation. AI models can analyse large volumes of heterogeneous environmental data, identify hidden correlations among environmental variables, and detect anomalies that may signal emerging environmental risks. For example, machine learning algorithms can detect subtle patterns indicating air quality degradation, water contamination events, or abnormal ecosystem behaviour long before they become visible through traditional monitoring methods. Similarly, predictive models can forecast environmental changes by analysing historical trends together with real-time measurements.
When integrated into a digital twin architecture, these analytical capabilities become even more powerful. A digital twin can be understood as a dynamic virtual representation of a physical system, in this case, an environmental ecosystem, a monitored territory, or an industrial-environment interface. The digital twin continuously synchronises with real-world sensor data, allowing the system to simulate environmental dynamics, evaluate potential scenarios, and assess the consequences of different interventions. This creates an entirely new level of environmental decision support. Instead of relying solely on historical reports or delayed monitoring results, decision-makers can access real-time environmental intelligence. They can visualise environmental indicators, monitor risk levels, and evaluate predictive models that estimate the evolution of environmental conditions under different scenarios.
For instance, digital twin simulations can help answer questions such as: What happens if industrial emissions increase under certain weather conditions? How would a change in resource consumption affect environmental sustainability targets? What environmental impact could emerge from specific operational decisions? These capabilities transform environmental monitoring into a predictive and proactive management system.
Another important advantage lies in integrated data fusion. Environmental phenomena are rarely driven by a single variable; they emerge from complex interactions among multiple factors. By combining environmental sensors, operational data, satellite observations, and contextual information, AI systems can build multivariate environmental models capable of capturing these complex interactions. This integrated approach significantly improves the accuracy of environmental risk prediction and supports more robust decision-making.
Equally important is the human-centric dimension of these technologies. Environmental monitoring systems are only effective if their insights are understandable and actionable for human decision-makers. Explainable AI techniques, interactive dashboards, and AI-powered assistants help translate complex analytical results into clear recommendations. Operators, environmental managers, and policymakers can therefore understand not only what is happening, but also why it is happening and what actions may mitigate potential risks. In practice, this means that environmental monitoring evolves from simple data observation into a decision-support ecosystem where AI continuously analyses environmental conditions, identifies emerging risks, and suggests mitigation strategies.
Finally, these technologies also support sustainability objectives. By enabling early detection of inefficiencies, pollution events, or resource misuse, AI-driven monitoring systems help organisations reduce environmental impact, optimise resource consumption, and improve compliance with environmental regulations. In the long term, the integration of artificial intelligence, distributed sensing, and digital twin modelling will enable a new generation of environmental monitoring systems that are adaptive, predictive, and decision-oriented. Such systems will not only observe environmental change but will actively support the management of environmental systems in a way that is more sustainable, resilient, and informed by real-time data intelligence.
And ultimately, this is the direction in which environmental technology is moving: toward a world where data, intelligence, and simulation work together to support smarter and more responsible decisions about our environment.
Sentinel EO Data - SAR and Multispectral Monitoring
Sentinel-1
Click here to download the PDF
SAR Introduction and Sentinel 1 Fundamentals
Welcome. In this video, we explore one of the most powerful technologies used in Earth observation today: Synthetic Aperture Radar, commonly referred to as SAR. We focus on the Sentinel 1 mission, which represents the radar component of the European Union’s Copernicus Earth observation programme, and use it as a reference to understand how radar systems observe the Earth’s surface under conditions where optical sensors are limited. From this starting point, we will examine how SAR works from a physical and technical perspective, including how radar signals interact with the surface, how images are formed and how geophysical measurements can be extracted from the data.
Sentinel 1 is a radar imaging mission developed by the European Space Agency and consists of two satellites, Sentinel 1A and Sentinel 1B. These satellites operate in the same orbit but are phased to ensure frequent and consistent observations of the Earth’s surface. Each satellite is equipped with a C-band Synthetic Aperture Radar instrument, operating at microwave frequencies with a wavelength of approximately 5.6 centimeters.

Unlike optical sensors, which rely on sunlight reflected from the Earth, Sentinel 1 is an active sensor. It emits its own microwave signal toward the surface and measures the portion of that signal that is reflected back. This capability allows Sentinel 1 to observe the Earth independently of daylight conditions and largely independently of atmospheric effects such as cloud cover. For this reason, radar data plays a critical role in operational monitoring systems, where continuous and reliable observations are required. The mission provides systematic and high-resolution radar imagery that supports a wide range of applications, including land deformation monitoring, flood mapping, maritime surveillance, agricultural observation and infrastructure stability assessment.
To understand how this information is generated, it is necessary to briefly review the physical principles behind radar sensing. Radar systems operate by transmitting electromagnetic waves and measuring how these waves interact with the Earth’s surface. The transmitted signal travels at the speed of light and, when it encounters an object, part of the energy is scattered in different directions. A portion of this scattered energy returns to the radar sensor and is recorded. From this returned signal, two key quantities are measured: amplitude and phase.
The amplitude indicates how strongly a surface reflects the radar signal, providing information about the physical properties of the target. The phase, on the other hand, contains information about the distance between the satellite and the observed surface. These two components form the basis for extracting meaningful information from SAR data. Radar systems typically operate in the microwave region of the electromagnetic spectrum. These wavelengths are particularly useful because they interact with the physical structure of the surface in distinctive ways. For example, microwave signals can penetrate vegetation canopies and, in some conditions, even dry soil. This makes radar particularly effective for observing features that are not directly visible with optical sensors.

When a radar wave reaches the Earth's surface, the way it is reflected depends on several physical characteristics, the most important of which is surface roughness. If the surface is smooth relative to the radar wavelength, the signal is reflected away from the sensor in a specular manner, similar to a mirror. This is why calm water surfaces often appear very dark in radar images. If the surface is rough, the signal is scattered in multiple directions and a portion of that energy returns to the sensor. Urban environments are a typical example of this behavior, where buildings and infrastructure generate strong radar reflections due to multiple scattering between vertical and horizontal surfaces, a phenomenon often referred to as the corner reflector effect. This results in a strong backscatter signal, making urban areas clearly distinguishable in radar imagery.
Another important factor is the dielectric property of the material. Surfaces with higher dielectric constants, such as wet soils, tend to reflect more radar energy than dry surfaces. This allows radar data to be used for detecting variations in soil moisture and surface water conditions. Vegetation also plays a significant role in radar scattering. Leaves, branches and trunks create complex interactions with the radar signal, generating patterns that can be used to infer vegetation structure and density. Understanding these interaction mechanisms is essential for correctly interpreting SAR imagery, as the observed signal is always the result of a combination of surface geometry, material properties and environmental conditions.
Synthetic Aperture and SAR Image Formation

The term Synthetic Aperture Radar refers to a specific imaging technique that allows radar systems to achieve high spatial resolution without requiring physically large antennas. In traditional radar systems, image resolution depends directly on the size of the antenna. A larger antenna provides better angular resolution, but in satellite applications, building very large antennas is not practical. SAR overcomes this limitation by exploiting the motion of the satellite along its orbit. As the satellite moves, the radar instrument repeatedly transmits pulses toward the same ground area. Each of these pulses is recorded together with the amplitude and phase of the returned signal.

Because the satellite changes position over time, each measurement is effectively acquired from a slightly different location along the orbit. By combining all these observations through advanced signal processing, it is possible to simulate the effect of a much larger antenna. This process creates what is known as a synthetic aperture, which is significantly larger than the physical antenna mounted on the satellite. The result is a radar image with much higher spatial resolution than would otherwise be achievable.
SAR images are constructed using two spatial dimensions: range and azimuth. The range dimension corresponds to the distance between the radar sensor and the target. Range resolution depends on the duration of the transmitted radar pulse, with shorter pulses providing finer resolution.

The azimuth dimension corresponds to the direction of the satellite’s motion. Azimuth resolution is achieved through the synthetic aperture process, which combines multiple observations collected over time. By coherently integrating radar echoes acquired along the orbit, the system can distinguish objects that are very close to each other along the flight path. This process requires precise control and analysis of the phase information contained in the radar signal.
The generation of a SAR image involves several processing steps. Initially, the radar system records raw echoes as complex signals containing both amplitude and phase. These signals must then be processed to reconstruct a coherent and geometrically accurate image. Key steps in this process include range compression, azimuth compression, motion compensation and radiometric calibration. Range compression improves resolution in the distance direction by correlating the received signal with the transmitted pulse.
Azimuth compression combines multiple radar echoes acquired during the satellite motion, enabling the synthetic aperture effect. Motion compensation ensures that any deviations in the satellite trajectory are correctly accounted for, preserving geometric accuracy. Radiometric calibration converts the raw signal into standardized backscatter values, allowing meaningful comparison across different acquisitions. The final result is a radar image in which each pixel represents the backscatter intensity associated with a specific ground location.
Interferometric SAR, Polarization and Applications
One of the most powerful capabilities of SAR technology is interferometry, commonly referred to as InSAR. InSAR is based on the comparison of multiple radar images acquired either from slightly different positions or at different times. By analyzing the phase differences between these acquisitions, it becomes possible to detect very small variations in the distance between the satellite and the ground.

These variations can correspond to ground displacement on the order of millimeters, making InSAR a highly effective tool for monitoring surface deformation. Because Sentinel 1 provides frequent and geometrically consistent observations of the same areas, it is particularly well suited for interferometric analysis over time. Through this approach, it is possible to monitor a wide range of geophysical processes, including land subsidence, tectonic deformation, volcanic activity, landslides and infrastructure stability. In addition to interferometry, another important concept in radar remote sensing is polarization.

Radar signals can be transmitted and received with different polarization states, typically horizontal or vertical. Different surface types interact with these polarization configurations in different ways, producing distinct scattering responses. By analyzing multiple polarization channels, it is possible to extract additional information about surface structure and scattering mechanisms. This is particularly useful in applications such as vegetation analysis, forest monitoring and agricultural assessment.
The combination of SAR imaging, interferometric techniques and polarization analysis makes Sentinel 1 a highly versatile system for Earth observation. For example, in flood monitoring, water surfaces tend to appear dark in radar imagery due to specular reflection, allowing flooded areas to be identified even under cloud cover. In deformation monitoring, interferometric analysis enables the detection of slow ground movements that are not visible through conventional observation methods. In agriculture, the sensitivity of radar signals to soil moisture and vegetation structure provides valuable insights into crop conditions.
In maritime applications, SAR can detect ships and monitor sea ice regardless of weather conditions. In infrastructure monitoring, radar-based deformation measurements can help identify structural instability in buildings, bridges and other assets. Overall, SAR represents a fundamental component of modern Earth observation. By combining microwave sensing, satellite motion and advanced signal processing, it enables continuous monitoring of the Earth’s surface under conditions where optical systems are limited.
The Sentinel 1 mission has made this technology widely accessible through the Copernicus programme, providing a reliable source of data for scientific, operational and decision-making applications. When integrated with optical and atmospheric observations from other Sentinel missions, SAR contributes to a more comprehensive and multi-dimensional understanding of environmental processes.
Advanced Applications of Sentinel 1: Landslides, Subsidence and Phase Displacement
We now move from the theoretical principles of SAR and interferometry to a set of advanced applications based on Sentinel 1 data. In particular, we will focus on three key phenomena: landslides, subsidence and phase displacement monitoring. All these applications rely on interferometric analysis, which allows us to measure ground deformation with millimetric precision and to observe how it evolves over time. The objective is to understand how these techniques can be applied in real-world scenarios to monitor terrain stability, assess risks and support decision-making processes.
Sentinel 1 is particularly well suited for this type of analysis thanks to its acquisition characteristics. It provides consistent observations over time, frequent revisit intervals and stable imaging geometry, all of which are essential for reliable time-series analysis. By applying interferometric techniques such as Differential InSAR, Persistent Scatterer Interferometry and Small Baseline Subset approaches, it becomes possible to detect very small surface displacements and to track their evolution across multiple acquisitions. These approaches differ in how they select stable targets and reconstruct deformation over time, enabling reliable analysis even in complex environments.
Let us begin with landslide monitoring. Landslides are often associated with factors such as intense rainfall, soil saturation, seismic activity or slope instability. However, in many cases, they are preceded by gradual ground deformation that may not be detectable through traditional observation methods. Sentinel 1 allows the identification of these pre-failure signals by analyzing phase variations over time. By comparing repeated acquisitions of the same slope, it is possible to detect slow displacement patterns and identify areas that are progressively becoming unstable. Through time-series analysis, operators can recognize active slopes, areas with increasing deformation rates and zones that may be at risk of failure.
In operational scenarios, this information can be used to support early warning systems. Monitoring a slope over time makes it possible to detect acceleration in displacement, which is often a critical precursor of slope failure. This allows authorities to take preventive actions, such as restricting access, reinforcing the terrain or deploying additional monitoring systems.
We now move to subsidence monitoring. Subsidence refers to the gradual sinking of the ground surface and can affect large areas over long periods. It is commonly associated with groundwater extraction, mining activities, soil compaction or urban development. Using Sentinel 1 data, subsidence can be measured through time-series interferometric analysis. This process typically involves identifying stable reference points, tracking phase changes across multiple acquisitions and converting these phase variations into displacement values. By tracking phase changes across multiple acquisitions, it is possible to estimate displacement velocities and generate maps that represent ground movement over time. In these maps, negative values typically indicate downward motion, while positive values correspond to uplift.
These maps allow the identification of spatial patterns, such as uniform subsidence across an area or localized deformation linked to specific activities. In urban environments, this type of analysis is particularly valuable. It enables the detection of differential subsidence that may affect buildings, roads or infrastructure networks. By identifying areas with higher deformation rates, planners and engineers can prioritize interventions, monitor critical zones and reduce the risk of structural damage.
The third aspect is phase displacement monitoring, which represents a more general approach to deformation analysis. Phase displacement refers to changes in the radar signal phase over time, which correspond to variations in the distance between the satellite and the ground along the radar line of sight. This measurement includes both vertical motion and horizontal motion toward or away from the satellite, meaning it does not represent purely vertical displacement. By analyzing multiple acquisitions, it is possible to reconstruct deformation time series for individual locations. This allows the identification of gradual trends, seasonal variations and sudden changes in ground movement.
Phase displacement monitoring is widely used in infrastructure analysis. For example, bridges, buildings or other structures can be monitored over time by identifying stable radar targets and tracking their displacement. If the observed time series shows consistent movement, acceleration or irregular behavior, this may indicate potential structural issues. One of the key advantages of this approach is that it is non-invasive, as it does not require the installation of physical sensors on the structure. In real-world applications, landslide monitoring, subsidence analysis and phase displacement are often used together.
Each approach provides a different perspective on ground dynamics. Landslide analysis focuses on slope instability, subsidence highlights vertical ground movement over large areas and phase displacement provides a detailed temporal description of deformation. By integrating these analyses, it becomes possible to obtain a more comprehensive understanding of terrain behavior. To further improve interpretation, Sentinel 1 data can be combined with additional sources of information, such as Digital Elevation Models, rainfall data, geological maps or in-situ measurements. This multi-source approach increases the reliability of the analysis and supports more informed decision-making.
At the same time, it is important to consider some limitations of radar-based measurements. Displacement is measured along the radar line of sight, which means it does not directly correspond to purely vertical or horizontal motion. Vegetation can reduce signal coherence, atmospheric conditions may introduce noise and complex terrain can lead to phase interpretation challenges. Understanding these limitations is essential for correctly interpreting the results and avoiding misinterpretation.
Data Visualization in EagleArca
We are now going to explore how Sentinel 1 radar data can be visualized and used within the EagleArca platform and how its analytical value increases when it is combined with other geospatial information. The objective is not simply to access satellite data, but to understand how this data is transformed into an interactive analytical layer that allows users to observe and interpret ground deformation processes such as subsidence and displacement over time. Within EagleArca, Sentinel 1 data is available as a dedicated geospatial layer derived from interferometric analysis. This layer provides information about ground displacement along the radar line of sight, enabling the monitoring of terrain dynamics over time.
By interacting with the map, it is possible to select specific areas of interest and access the associated data. Among the available information is the average deformation velocity, typically calculated over a temporal baseline of approximately two years. This value represents the rate of ground movement and allows users to quickly identify areas affected by subsidence or uplift. In addition to this aggregated value, the platform also provides access to the temporal evolution of deformation. For each selected location, a time series is available, showing how displacement changes over time.
This temporal representation makes it possible to recognize different patterns. A linear trend may indicate a steady and continuous deformation process, while non-linear trends, seasonal oscillations or sudden variations may reveal more complex dynamics related to environmental conditions or structural factors. In this way, the Sentinel 1 layer is not just a static map, but an analytical tool that allows users to understand not only where deformation occurs, but also how it evolves over time. A key feature of the EagleArca platform is that all layers are georeferenced within the same coordinate system. This allows Sentinel 1 data to be seamlessly combined with other geospatial datasets, enabling integrated analysis.
For example, when deformation data is combined with a Digital Elevation Model, it becomes possible to analyze how ground movement relates to terrain morphology. Subsidence in flat areas may indicate potential water accumulation issues, while deformation along slopes may suggest instability or landslide risk. Similarly, integrating Sentinel 1 data with land use or land cover information helps distinguish between deformation occurring in urban areas, agricultural fields or natural environments, providing essential context for interpretation.
In urban scenarios, combining deformation data with infrastructure layers such as buildings, roads or pipelines allows the identification of critical assets that may be affected by ground movement, supporting risk assessment and maintenance planning. In agricultural contexts, Sentinel 1 data can be combined with information derived from Sentinel 2 or other environmental indicators, making it possible to analyze the relationship between soil conditions, irrigation practices and seasonal dynamics. Another important integration is with meteorological data, such as rainfall and temperature. By correlating deformation patterns with environmental variables, it becomes possible to investigate how external factors influence ground movement.
The key point is that, while the Sentinel 1 layer provides valuable information on its own, its full analytical potential emerges when it is integrated with other datasets, such as terrain models, land use information, environmental indicators and meteorological data, allowing multiple variables to be analyzed together. From an operational perspective, EagleArca enables users to dynamically activate and deactivate layers, adjust visualization parameters and interact with specific locations to access detailed information. This interactive approach is particularly important when working with complex datasets such as SAR-derived deformation, which always require contextual interpretation. Moreover, the ability to observe both spatial distribution and temporal evolution within the same environment provides a comprehensive understanding of the monitored area.
In conclusion, the visualization of Sentinel 1 data in EagleArca demonstrates how advanced satellite analytics can be transformed into accessible and actionable information. By combining spatial analysis, temporal monitoring and multi-layer integration, the platform enables users to better understand and manage ground deformation phenomena.
Interpreting Geospatial Layers and Practical Applications
Once geospatial data has been visualized, the next step is to understand how to interpret it correctly and how to translate that information into practical applications. Geospatial analysis is based on the concept of layers, where each layer represents a specific type of information associated with a geographic location. These layers can include satellite-derived data, terrain models, land use classifications, infrastructure maps or environmental indicators. Each layer contains values that describe a particular physical or modeled variable. In the case of raster data, these values are organized in pixels, while vector data is represented through geometries such as points, lines and polygons.
Interpreting these layers requires understanding both what the data represents and how it has been generated. When analyzing a layer for the first time, it is important to avoid interpreting values in isolation. A single value may provide limited information, while its meaning becomes clearer when considered within its spatial context. For this reason, one of the most important aspects of geospatial interpretation is the ability to recognize spatial patterns. For example, clusters of high values may indicate localized anomalies, while linear patterns can follow infrastructure or geological features. The distribution of values across an area often reveals underlying processes that are not immediately visible at a single point. For example, clusters of similar values may indicate consistent environmental conditions, while gradients or abrupt changes can suggest transitions between different states or the presence of anomalies.
In addition to spatial patterns, temporal analysis also plays a crucial role. When time-series data is available, it becomes possible to observe how a variable evolves over time, identifying trends, seasonal variations or sudden changes. This temporal dimension is particularly important in applications such as environmental monitoring, infrastructure assessment and agricultural analysis, where processes are dynamic rather than static. Another key principle is the integration of multiple layers. Individual datasets provide partial information, but when combined, they allow a more comprehensive understanding of the system being observed.
For instance, in agriculture, combining vegetation indices, soil moisture information and temperature data can help explain variations in crop performance. In urban environments, integrating deformation data with infrastructure layers can support risk assessment and maintenance planning. In environmental analysis, combining terrain data with meteorological information can help identify areas exposed to flooding or erosion. In practical scenarios, geospatial layers are used to support decision-making across different domains. In agriculture, they contribute to monitoring crop conditions and optimizing resource use. In urban contexts, they support infrastructure management and planning. In environmental monitoring, they help identify risks and understand natural processes.
It is also important to consider that geospatial data is not limited to a single platform. One of the strengths of modern geospatial systems is their interoperability. Data can be exported and used in external GIS environments, enabling more advanced or customized analysis. Common formats include raster files such as GeoTIFF and vector formats such as Shapefiles, which can be imported into tools like QGIS. These environments allow users to perform more detailed spatial analysis, apply custom processing workflows and integrate additional datasets. The ability to move between different tools ensures flexibility in the analytical process. Initial exploration and visualization can be performed within platforms like EagleArca, while more advanced processing and modeling can be carried out in dedicated GIS software.
Ultimately, interpreting geospatial layers is both a technical and analytical task. It requires understanding the nature of the data, recognizing spatial and temporal patterns and integrating multiple sources of information into a coherent framework. As the availability of geospatial data continues to grow, the ability to interpret and use these layers effectively becomes increasingly important across a wide range of applications. In conclusion, geospatial layers are not simply visual elements on a map, but structured representations of complex spatial processes. When correctly interpreted and combined, they provide valuable insights that support informed decision-making in agriculture, urban planning and environmental monitoring.
Sentinel-2
Click here to download the PDF
SAR Introduction and Sentinel 2 Fundamentals
Welcome. In this video, we will explore Sentinel-2, one of the most important satellite missions for land observation and part of the European Union’s Copernicus Earth observation programme. The objective is to understand not only what Sentinel-2 is, but how it works from a technological perspective, how it measures the Earth’s surface through multispectral observations and how its data can be interpreted in real-world applications. Rather than treating satellite imagery as simple visual content, we will approach Sentinel-2 as a physical measurement system that records the interaction between electromagnetic radiation, the atmosphere and the Earth’s surface.
Its output is therefore not just an image, but quantitative information that supports analysis and inference. This distinction is methodological as well as conceptual. In Earth observation, it is not enough to know what is observed; it is also essential to understand how reliably the sensor measures it over time. This introduces concepts such as radiometric stability and calibration consistency, which are fundamental for multi-temporal analysis.
Sentinel-2 measurements become meaningful through analytical processes such as index computation, feature extraction, classification and time-series analysis. In this sense, Sentinel-2 is not only an imaging system, but a measurement platform that supports higher-level interpretation. We will begin by introducing the mission and its architecture, then move to the design of its multispectral sensor and finally explore how this data supports environmental monitoring, agriculture and geospatial analysis within structured workflows such as those implemented in EagleArca.
Sentinel 2 Mission Overview
Sentinel-2 is part of the European Union’s Copernicus Earth observation programme and is designed to provide systematic, high-resolution optical observations of the Earth’s land surface. More precisely, it delivers spatially detailed and spectrally rich measurements that support continuous environmental monitoring rather than occasional image acquisition. As an optical mission, Sentinel-2 is a passive sensing system. It does not emit its own signal, but records solar radiation reflected by the Earth’s surface and atmosphere. What it acquires is therefore not a direct image, but a multispectral measurement influenced by both surface properties and atmospheric conditions.
The mission is based on a two-satellite constellation composed of Sentinel-2A and Sentinel-2B. These satellites operate in the same orbital plane and are phased to ensure frequent and consistent observations of the same areas over time. This configuration improves revisit time, increases the temporal density of observations and supports the monitoring of dynamic processes such as vegetation growth, land use change and environmental variability. This temporal dimension is fundamental because the value of Sentinel-2 often lies not in individual images, but in consistent time series acquired under stable geometric and radiometric conditions. This enables the analysis of trends, seasonal cycles and anomalies, while also increasing the probability of obtaining usable cloud-free observations, which remains one of the main limitations of optical remote sensing.
From an orbital perspective, Sentinel-2 operates in a sun-synchronous orbit, meaning that it passes over the same location at approximately the same local solar time during each revisit. This stabilizes illumination geometry, reduces variability caused by changing sun angles and improves the physical consistency of temporal comparisons. The mission operates at an altitude of approximately 786 kilometers, representing a balance between spatial resolution, swath width and coverage efficiency. This allows Sentinel-2 to observe large areas while maintaining sufficient spatial detail for operational analysis at field and landscape scale.
Overall, Sentinel-2 is designed for continuous and repeatable monitoring of land surfaces, with particular focus on vegetation, soil conditions, inland waters and coastal areas, making it especially suitable for time-series analysis and change detection.
Sensor Architecture: MultiSpectral Instrument and Pushbroom Design
At the core of Sentinel 2 is its primary payload, known as the MultiSpectral Instrument, or MSI. This instrument is responsible for acquiring multispectral data, meaning that it measures reflected solar radiation across multiple wavelengths of the electromagnetic spectrum. These measurements capture how different surfaces interact with radiation, allowing the analysis of physical and biophysical properties rather than simply producing visual imagery.
One of the key characteristics of MSI is that it is based on a pushbroom acquisition system. In a pushbroom sensor, data is collected line by line as the satellite moves along its orbit. Instead of scanning the ground using moving mirrors, the instrument uses a linear array of detectors that continuously captures an entire line across the swath. As the satellite advances, these lines are sequentially recorded and combined into a two-dimensional image. This design offers several important advantages. One important technical aspect of this configuration is the improvement in signal-to-noise ratio.
Because each detector continuously observes the same ground track as the satellite moves forward, the integration time per pixel is higher compared to scanning systems. This leads to a stronger and more stable signal, which is particularly important for detecting subtle variations in surface reflectance. It reduces mechanical complexity, improves radiometric stability and allows for consistent multispectral acquisition across a wide swath of approximately 290 kilometers.
Radiometric consistency is essential for temporal analysis. If the sensor calibration were to drift over time, it would become difficult to distinguish between actual surface changes and variations introduced by the instrument itself. For this reason, Sentinel 2 is designed with strict calibration protocols to ensure long-term measurement consistency. Because of these characteristics, pushbroom systems are particularly well suited for large-scale and systematic Earth observation missions such as Sentinel 2, where continuous, repeatable and quantitatively consistent measurements are required.
The MSI instrument is specifically designed to support detailed analysis of land surfaces, enabling the observation of vegetation, soil properties and environmental conditions through its multispectral measurements, which can be further interpreted through spectral analysis, indices and time-series approaches.
Spectral Design: Understanding the Multispectral Bands
One of the defining features of Sentinel-2 is its spectral design. The MultiSpectral Instrument acquires data across 13 spectral bands distributed over the visible, near-infrared, red-edge and short-wave infrared regions of the electromagnetic spectrum. These bands are the result of a deliberate scientific and engineering design, where each wavelength range is selected to capture specific surface and biophysical properties, enabling physically meaningful analysis of vegetation, soil, water and environmental processes. These bands are not acquired at the same spatial resolution. Some are provided at 10 meters, others at 20 meters and others at 60 meters.
This multi-resolution structure reflects a trade-off between spectral sensitivity, spatial detail, swath width and acquisition efficiency. More generally, Sentinel-2 is a strong example of balanced satellite design, since spatial resolution, spectral richness, revisit time and coverage cannot all be maximized at once. Let us begin with the visible region. The visible bands include blue, green and red wavelengths, corresponding to the portion of the spectrum perceived by the human eye and allowing the reconstruction of natural-color images. Their role, however, goes beyond visualization. The blue band is useful for atmospheric correction and water-related analysis, the green band contributes to vegetation and surface characterization and the red band is essential for vegetation analysis because chlorophyll strongly absorbs radiation in this region.
Moving beyond the visible region, we enter the near-infrared, or NIR. Healthy vegetation strongly reflects near-infrared light due to the internal structure of plant leaves. The contrast between red absorption and near-infrared reflection is fundamental for distinguishing vegetation from other surface types and forms the basis for many spectral indices used in remote sensing. Sentinel-2 also includes red-edge bands, located in the transition zone between red and near-infrared wavelengths. This region is highly sensitive to chlorophyll content and plant condition, making it valuable for detecting subtle changes in vegetation status. This is one of Sentinel-2’s key innovations compared to earlier multispectral missions and supports applications such as precision agriculture and ecosystem monitoring.
Finally, Sentinel-2 includes short-wave infrared, or SWIR, bands. These wavelengths are especially important for analyzing moisture and surface composition. Since water absorbs strongly in the SWIR region, wet surfaces appear darker than dry ones. This makes SWIR bands useful for detecting soil moisture variations, assessing vegetation water content, identifying burned areas and analyzing changes in surface conditions. By combining information from visible, near-infrared, red-edge and short-wave infrared bands, Sentinel-2 provides a spectrally rich representation of the Earth’s surface. Each pixel contains a spectral signature that encodes the interaction between radiation, atmosphere and surface and can be transformed into meaningful indicators for classification, index computation and environmental monitoring.
Spatial Resolution and Swath Design
In addition to its spectral capabilities, Sentinel 2 is characterized by a multi-resolution acquisition system. Not all spectral bands are captured at the same spatial resolution. Instead, the data is provided at three different levels: 10 meters, 20 meters and 60 meters. This structure is not arbitrary, but reflects a deliberate design choice aimed at balancing spectral sensitivity, spatial detail and acquisition efficiency within the constraints of spaceborne observation.
The 10-meter resolution bands include the most operationally relevant channels for land observation, particularly in the visible and near-infrared regions. These bands provide the spatial detail required for mapping vegetation patterns, agricultural fields, urban structures and land cover features at a scale that is directly usable for operational analysis. The 20-meter bands include the red-edge and short-wave infrared channels. These bands are extremely valuable from a spectral perspective, as they capture key biophysical properties such as chlorophyll variation and moisture content, but they are more demanding in terms of sensor design and signal quality. The 20-meter resolution therefore represents a compromise that preserves spectral information while maintaining acceptable spatial detail.
The 60-meter bands are mainly used for atmospheric correction and support functions. In this case, spatial detail is less critical because the objective is to characterize atmospheric effects rather than resolve fine surface structures, allowing these bands to be optimized for calibration and correction purposes. This multi-resolution structure reflects a broader engineering trade-off. More generally, Earth observation missions are constrained by a fundamental trade-off between spatial resolution, spectral richness, temporal revisit and swath width. Improving one of these dimensions typically comes at the expense of the others.
Sentinel 2 is designed as a balanced system, providing sufficient performance across all four dimensions to support both detailed analysis and large-scale, operational monitoring. In practice, it is not possible to simultaneously maximize all these dimensions without significant constraints. Sentinel 2 achieves an effective balance between these factors, delivering data that is both information-rich and operationally scalable across large areas. Another important aspect is the swath width, which is approximately 290 kilometers. This wide coverage allows Sentinel 2 to observe large portions of the Earth’s surface during each acquisition, contributing to frequent revisit times and enabling systematic, repeatable monitoring rather than isolated observations.
It also ensures that the data can be efficiently integrated into large-scale analysis workflows, where regional or continental coverage is required. As a result, Sentinel 2 supports both local and regional applications, making it suitable for a wide range of monitoring activities, from precision agriculture to large-scale environmental assessment and enabling seamless integration with other geospatial datasets within GIS environments. This effectively places Sentinel 2 at an intermediate or meso-scale, level of observation. Its spatial resolution is fine enough to capture field-level and urban patterns, while its wide coverage enables regional and large-scale analysis. This makes it particularly effective for applications that require both spatial detail and broad geographic context.
What Sentinel 2 Actually Measures
To properly interpret Sentinel 2 data, it is important to understand what the sensor actually measures. Sentinel 2 is an optical passive sensor. This means that it does not emit its own signal, but instead records solar radiation that is reflected by the Earth’s surface and modified by the atmosphere. The sensor does not directly measure objects. Instead, it measures radiance. This radiance can be transformed into reflectance, which is more directly related to surface properties. This distinction is fundamental because most quantitative analyses rely on surface reflectance rather than raw sensor measurements. Reflectance describes how incoming radiation interacts with materials according to their physical and chemical properties.
The measurement process involves a sequence of physical interactions. Sunlight first travels through the atmosphere, where part of the radiation is scattered and absorbed. The remaining radiation reaches the Earth’s surface, where it interacts with vegetation, soil, water or artificial structures. Each of these surfaces reflects radiation differently, producing distinct spectral responses. The reflected signal then travels back through the atmosphere, undergoing further modifications before being detected by the satellite sensor. As a result, what Sentinel 2 records is not a simple photograph, but a multispectral measurement that integrates the combined effects of surface properties and atmospheric conditions.
This is why the signal cannot be interpreted directly as a visual image, but must be understood as a physical measurement influenced by multiple factors. Because of this, the measured signal is affected not only by the surface itself, but also by atmospheric variability, which can introduce distortions and reduce comparability between acquisitions. For this reason, atmospheric correction plays a central role in data processing, especially when quantitative analysis or time-series comparison is required.
To support different types of analysis, Sentinel 2 data is typically distributed in multiple processing levels. One level represents top-of-atmosphere reflectance, which corresponds to the signal as measured by the sensor, including atmospheric effects. Another level represents surface reflectance, where atmospheric contributions have been reduced to better approximate the intrinsic properties of the observed surface. This distinction is essential when comparing data over time or extracting quantitative indicators, because variations in the signal may originate either from real surface changes or from differences in atmospheric conditions. Understanding this measurement process is fundamental, because it clarifies that each pixel represents a physically derived spectral response over an area, and that Sentinel 2 data must always be interpreted in terms of radiative interaction and not simply as a visual representation of the Earth’s surface.
Data Interpretation Fundamentals
Once we understand how Sentinel-2 measures the Earth’s surface, the next step is to understand how to interpret its data. Each pixel does not represent an object directly, but contains a set of reflectance values measured across the spectral bands and integrated over a finite ground area. Together, these values form a spectral signature, which describes how a surface interacts with radiation across different wavelengths.
Different materials, such as vegetation, soil, water or artificial surfaces, exhibit distinct spectral behaviors and this allows us to distinguish them. However, spectral signatures are not uniquely interpretable on their own. Similar responses can correspond to different surface conditions, so interpretation requires spectral, spatial and temporal context. For this reason, Sentinel-2 data should not be treated only as visual imagery, but as quantitative measurements. A true-color image can support orientation and general understanding, but the real analytical value emerges when we examine the relationships between spectral bands.
A key example is the Normalized Difference Vegetation Index, or NDVI. NDVI is based on the contrast between red and near-infrared reflectance: vegetation absorbs strongly in the red band and reflects strongly in the near-infrared. By combining these bands, NDVI provides an indicator of vegetation vigor. High values generally correspond to dense and active vegetation, while lower values may indicate sparse vegetation, stressed crops, bare soil or non-vegetated surfaces. However, NDVI is not a direct measurement of vegetation health, but a proxy derived from spectral behavior. A stressed crop field may show lower NDVI values than healthy vegetation even before this is clearly visible in standard imagery, but similar NDVI values can still correspond to different conditions depending on season, crop type and environmental context.
In addition to NDVI, Sentinel-2 red-edge bands allow more sensitive analysis of vegetation condition. They capture subtle variations in chlorophyll content and canopy structure, making it possible to detect stress earlier than with standard vegetation indices. Beyond indices, spectral signatures can also support classification and modeling processes, where pixels are assigned to thematic categories such as vegetation, water, soil or built-up areas. In this sense, Sentinel-2 acts as a source of data for higher-level inference, rather than as a direct provider of semantic information.
Spatial context is essential. A single pixel value has limited meaning on its own, while clusters, gradients and boundaries can reveal processes that are not visible at the level of an individual measurement. Temporal context is equally important. By building time series of observations acquired under consistent conditions, it becomes possible to analyze how spectral signatures evolve, identify trends, recognize seasonal cycles and distinguish normal variability from significant change. Understanding these principles is essential, because interpretation always depends on the combination of spectral information, spatial patterns, temporal evolution and contextual knowledge, transforming raw measurements into meaningful insight.
Practical Applications
The principles discussed so far support a wide range of practical applications. These are not generic uses of satellite imagery, but applications derived from the spectral, spatial and temporal properties of Sentinel-2 data, which allow surface processes to be observed in a consistent and quantitative way.
In agriculture, Sentinel-2 supports crop monitoring over time. Vegetation indices, spectral patterns and red-edge information make it possible to identify spatial variability in crop development, detect early anomalies and distinguish normal seasonal dynamics from stress conditions related to soil properties, irrigation efficiency, nutrient availability or plant health. Time-series analysis also supports phenological monitoring, helping track growth stages, delays and crop behavior at both field and regional scale. Another key application is land cover classification. By analyzing spectral signatures, each pixel can be associated with categories such as vegetation, water, soil or built-up surface. This can be done through rule-based approaches or machine learning techniques, producing thematic maps that transform raw measurements into structured geographic information for planning, monitoring and reporting.
In environmental monitoring, Sentinel-2 enables the observation of ecosystems and natural processes. Forest dynamics, vegetation change, degradation, recovery and disturbance events can be analyzed by comparing spectral responses across multiple acquisitions. Burned areas, for example, show characteristic changes, especially in the short-wave infrared region. Hydrological applications rely on the distinct spectral behavior of water, particularly in the near-infrared and short-wave infrared regions. This makes it possible to delineate rivers, lakes and reservoirs and monitor changes in water extent linked to seasonal dynamics, floods or droughts. Visible reflectance can also provide qualitative indications of sediment presence or biological activity, although these signals require careful interpretation.
In urban and land use analysis, Sentinel-2 allows major land cover categories such as built-up areas, vegetation and bare soil to be distinguished. This supports the monitoring of urban expansion, land consumption and green space distribution, providing useful information for urban planning, environmental assessment and infrastructure management. A particularly powerful capability is change detection. By comparing observations acquired at different times under consistent conditions, Sentinel-2 supports the analysis of vegetation changes, land use transformation, water extent variation and post-disaster impacts. This shifts the focus from static mapping to dynamic analysis, where processes are interpreted through their evolution over time.
Finally, Sentinel-2 interpretation becomes stronger when integrated with other data sources. Its geometric accuracy allows reliable alignment with other geospatial datasets, which is essential for multi-source analysis. When combined with Sentinel-1 radar observations, elevation models, meteorological data and in-situ measurements, Sentinel-2 provides a more complete picture of surface conditions, reduces interpretative ambiguity and supports more robust decision-making across different spatial and temporal scales.
Sentinel 2 Data Visualization in EagleArca
We now move to how Sentinel-2 data can be visualized and interpreted within the EagleArca platform. In EagleArca, geospatial information is organized into layers that can be visualized, combined and explored in a unified environment. Sentinel-2 data is available within this system, allowing multispectral observations to be consulted alongside other geospatial datasets.
A first level of interaction is the visual representation of the observed area. By combining spectral bands, the platform reconstructs an optical view of the territory, supporting the recognition of vegetation, water bodies, soil and built-up areas. This view helps with orientation and initial interpretation. However, Sentinel-2 does not directly provide semantic information such as land cover classes. It provides multispectral measurements, which must be interpreted according to their spectral behavior. Within EagleArca, users can explore these measurements and distinguish land cover types such as vegetation, bare soil, water surfaces and built environments.
The platform provides a super-resolved reconstruction at approximately 1 meter to enhance visual interpretation. The classification layer is available both at approximately 10 meters and at an enhanced resolution close to 1 meter. These representations improve the readability of spatial patterns and help relate spectral information to real-world features. Sentinel-2 also contributes to higher-level thematic layers such as Agriculture and Urbanization, supporting domain-specific analysis. These layers should be interpreted as thematic representations that support analysis, rather than direct outputs of the satellite.
A key aspect of EagleArca is the integration of Sentinel-2 data with other geospatial layers. Since all data is georeferenced, Sentinel-2 observations can be overlaid with terrain models, infrastructure data or environmental variables. For example, vegetation patterns can be analyzed together with elevation, land use or environmental conditions to better understand the territory. From an operational perspective, EagleArca allows users to activate and deactivate layers, focus on specific areas and explore relationships between datasets. This interactive approach is essential when working with multispectral data, where interpretation depends on comparing multiple sources. In this way, Sentinel-2 within EagleArca is not just imagery, but part of an integrated geospatial environment that supports exploration, interpretation and decision-making.
Interpretation within a GIS Workflow
To fully exploit the potential of Sentinel 2 data, it is essential to consider how it is used within a broader geospatial workflow. Sentinel 2 provides quantitative multispectral measurements of surface reflectance and these measurements gain their full value when they are integrated with other sources of information and interpreted within a GIS-based environment. In this context, it does not operate in isolation, but becomes part of a layered analytical system where different datasets contribute complementary information.
By combining these observations with additional geospatial layers, such as elevation models, infrastructure data, meteorological information or radar measurements, it becomes possible to analyze relationships between environmental and spatial variables rather than observing them separately. Variations in vegetation patterns, for example, can be interpreted in relation to terrain characteristics, soil conditions or water availability, while land cover information can be compared with infrastructure or administrative boundaries to support planning and monitoring activities. This type of integration enables a transition from simple observation to structured interpretation. Meaning does not emerge from a single dataset alone, but from the relationships established between multiple sources of information, which together provide a more complete representation of the territory.
From an operational perspective, this workflow can be implemented within platforms such as EagleArca, where geospatial layers can be visualized, combined and explored interactively. At the same time, the same data can be exported in standard formats, such as GeoTIFF and used in external GIS tools like QGIS for more advanced processing, modeling and analysis. This flexibility allows users to adapt their workflow depending on the level of complexity required, moving from exploratory visualization to more advanced analytical approaches. Ultimately, integrating Sentinel 2 within a GIS workflow enables the transformation of raw multispectral measurements into structured, actionable information, supporting decision-making processes across a wide range of applications.
Sentinel-3
Click here to download the PDF
Sentinel-3 in the Copernicus Ecosystem
Welcome. In this video, we explore one of the most technically sophisticated missions within the Copernicus Earth Observation Programme: Sentinel-3. To understand what makes it distinctive, it helps to briefly place it within the broader context of the programme. Sentinel-1 is a radar mission that provides structural and surface deformation information regardless of cloud cover or lighting conditions. Sentinel-2 delivers high-resolution multispectral optical imagery, optimised for detailed land surface analysis at field and landscape scale. Sentinel-5P monitors the composition of the atmosphere, tracking pollutants and greenhouse gases at global scale. Sentinel-3 was designed with a different philosophy altogether.
Its mission is centred around the systematic observation of large-scale environmental dynamics: temperature, ocean conditions, vegetation status at regional scale, atmospheric composition, and climate-related processes. While Sentinel-2 can resolve individual fields and urban blocks at ten meters, Sentinel-3 operates at coarser spatial resolution but compensates with broader geographic coverage, stronger temporal consistency, and a fundamentally different measurement capability: the ability to measure the physical temperature of the Earth's surface. This makes Sentinel-3 not simply an imaging system, but an environmental monitoring platform in the full scientific sense. Its role is to observe how environmental variables evolve over time, contributing to our understanding of climate, ecosystems, agriculture, and urban thermal dynamics.
Mission Architecture and Instruments
The Sentinel-3 constellation consists of multiple satellites operating in a coordinated manner to ensure continuous global coverage and a high temporal revisit capability. Like other Copernicus missions, Sentinel-3 operates in a sun-synchronous orbit, meaning it passes over the same locations at approximately the same local solar time during each revisit. This stabilizes illumination geometry and ensures that observations acquired at different times remain comparable. What makes Sentinel-3 architecturally unique within the Copernicus family is its payload. Unlike Sentinel-2, which is built around a single multispectral instrument, Sentinel-3 incorporates multiple complementary instruments, each designed to observe a different component of the Earth system.
SLSTR: Sea and Land Surface Temperature Radiometer
The most important instrument for our discussion is the Sea and Land Surface Temperature Radiometer, known as SLSTR. This instrument is specifically designed to measure land and sea surface temperatures with high radiometric precision. It operates across multiple spectral channels, including visible, near-infrared, and thermal infrared wavelengths. The thermal infrared region is particularly important because all objects above absolute zero emit thermal radiation. By measuring this emitted radiation, Sentinel-3 can estimate the physical temperature of the Earth's surface. This is fundamentally different from Sentinel-2, which measures reflected solar radiation. SLSTR measures radiation that the surface itself emits.
OLCI: Ocean and Land Colour Instrument
The second major instrument is the Ocean and Land Colour Instrument, or OLCI. This is a multispectral optical instrument designed to measure reflected radiation across a large number of spectral bands. OLCI is particularly important for monitoring vegetation, water quality, chlorophyll concentration, and environmental conditions over both land and ocean surfaces. Although Sentinel-2 provides higher spatial resolution for detailed land observation, Sentinel-3 OLCI offers broader regional coverage and strong spectral sensitivity, making it useful for large-scale environmental assessments, vegetation monitoring at continental scale, and atmospheric correction support.
SRAL and Atmospheric Capabilities
The third instrument is the Synthetic Aperture Radar Altimeter, or SRAL. This instrument is more strongly associated with oceanography and water surface measurements, but it contributes to hydrological and environmental studies by enabling precise measurement of surface elevation, particularly for oceans, rivers, lakes, and ice surfaces. Its contribution is especially relevant for sea level monitoring, inland water dynamics, and hydrological analysis related to climate.
Finally, Sentinel-3 incorporates atmospheric observation capabilities that support the characterization of atmospheric particles, aerosols, and gases. This atmospheric dimension becomes particularly important when Sentinel-3 data is integrated with other missions such as Sentinel-5P, which focuses specifically on atmospheric composition, or with weather forecasting services. Together, these systems contribute to a more complete understanding of how surface observations connect to atmospheric dynamics.
What Sentinel-3 Measures
Environmental Variables
To properly understand the analytical value of Sentinel-3, it is necessary to move beyond the idea of satellite imagery as a visual product and think instead in terms of geophysical variables. Sentinel-3 generates multidimensional datasets that describe the physical state of the Earth system numerically. Each pixel is not simply a visual element, but a container of physical information describing environmental conditions at a specific location and a specific time.
Land Surface Temperature and Heat Fluxes
The most central variable produced by Sentinel-3 is Land Surface Temperature, commonly abbreviated as LST. This parameter represents the physical temperature of the Earth's surface itself. It is not the same as air temperature measured by a weather station. Instead, it describes the thermal state of the ground, vegetation, urban surfaces, or water bodies as observed from space through thermal infrared measurements. LST is an extremely important environmental variable because surface temperature controls many physical processes: energy balance, water stress in vegetation, urban heat accumulation, and climatic dynamics. In practice, LST is always provided alongside an uncertainty value, which quantifies the expected error margin and helps analysts understand the reliability of the retrieved temperature.
Alongside LST, Sentinel-3 provides two closely related variables that describe how energy is exchanged between the Earth's surface and the atmosphere: latent heat flux and sensible heat flux. Latent heat flux is associated with phase changes of water, particularly evaporation and transpiration. When water evaporates from a surface or is released by vegetation through transpiration, energy is absorbed from the surface and transferred into the atmosphere. In agricultural environments, latent heat is strongly connected to evapotranspiration and vegetation activity.
Sensible heat flux, by contrast, represents direct heat transfer between the surface and the air without phase change. Urban surfaces dominated by asphalt and concrete tend to exhibit strong sensible heat flux because these materials absorb solar radiation and release heat directly into the atmosphere. The balance between these two fluxes is extremely diagnostic. In vegetated and well-watered areas, latent heat tends to dominate because energy is consumed by evapotranspiration. In dry or highly urbanized areas, sensible heat dominates, leading to stronger surface warming. This balance is one of the most informative indicators in the entire dataset.
Soil, Atmosphere and Additional Variables
Sentinel-3 also provides soil wetness information, which estimates the amount of moisture present in the soil. This variable is critical for agriculture because soil moisture directly influences crop growth, irrigation efficiency, runoff generation, and drought risk.
Among the atmospheric variables, the dataset includes cloud fraction, which describes how much of the observed area is covered by clouds and therefore affects the reliability of surface measurements. Dew point temperature indicates the atmospheric moisture content and is related to condensation, fog formation, and moisture-related environmental conditions. Solar radiation describes the incoming solar energy reaching the surface, which drives photosynthesis, evaporation, thermal dynamics, and ecosystem productivity. Thermal radiation describes the energy emitted by the Earth's surface back into the atmosphere and space. Together, incoming solar radiation and outgoing thermal radiation define the Earth's radiative balance.
Total column water vapor and total column ozone provide integrated measurements of atmospheric moisture and ozone abundance. Ozone plays a critical role in absorbing harmful ultraviolet radiation, while water vapor is one of the most important greenhouse gases and strongly influences cloud formation and energy transfer. Specific humidity measures the mass of water vapor in the air relative to the total air mass; unlike relative humidity, it is independent of temperature, which makes it particularly useful for weather forecasting and atmospheric modeling.
Surface pressure influences weather systems and wind patterns. Wind speed and direction are reconstructed through two orthogonal components: the u-wind, oriented east-west, and the v-wind, oriented north-south. Together they describe atmospheric circulation dynamics that influence pollution dispersion, evapotranspiration, and thermal comfort. Additional variables include skin temperature at the surface-atmosphere interface, snow albedo and snow depth for hydrological and climate analysis, and temperature profiles through different atmospheric layers.
The key point is that these variables should never be interpreted in isolation. Their true value emerges through integration. A region with elevated land surface temperature, low soil wetness, high sensible heat flux, and low vegetation activity may indicate drought stress or degraded environmental conditions. An urban area with high thermal radiation and low latent heat may correspond to strong heat island effects. Environmental systems are interconnected, and it is precisely this interconnection that makes Sentinel-3 so powerful when used within a multi-layer analytical environment.
Applications in Urban Environments
The Heat Island Effect
One of the most important applications of Sentinel-3 data is the analysis of the Urban Heat Island effect. Urban areas tend to accumulate and retain more heat than surrounding rural areas. This happens primarily because urban materials such as asphalt, concrete, and dense infrastructure absorb solar radiation during the day and release it slowly during the night, accentuating the thermal differential with surrounding rural areas. Urban areas also tend to have less vegetation, which would otherwise contribute to natural cooling through evapotranspiration. As a result, cities retain heat for longer periods, reaching significantly higher temperatures compared to neighboring undeveloped areas.
This effect has several practical consequences. It increases energy consumption for cooling systems, raising economic costs. It creates health risks, particularly for vulnerable populations, through increased exposure to heat. It also contributes to air quality deterioration, since higher temperatures can promote the formation of air pollutants such as ozone. In agricultural areas adjacent to urban centers, elevated temperatures can affect growing conditions and crop performance. Using Sentinel-3 thermal data, it becomes possible to spatially identify areas with elevated surface temperatures across urban environments. Zones with poor vegetation coverage and high building density often exhibit significantly higher thermal signatures compared to parks or peri-urban green areas.
Identifying heat accumulation zones allows urban planners to implement targeted cooling strategies: the creation or expansion of green spaces, the introduction of cool roofs, or the use of reflective materials in construction to reduce heat absorption. Monitoring these zones over time then makes it possible to evaluate whether such interventions are actually reducing thermal stress. This type of analysis is particularly critical in urban planning, helping to assess the effectiveness of climate resilience measures and to guide decisions about future urban development.
Applications in Agriculture
Thermal Stress and Water Management
In agricultural contexts, the role of Sentinel-3 is equally important, though the interpretation shifts toward a different set of processes. Crops are strongly sensitive to temperature conditions. Elevated surface temperature can indicate water stress, drought conditions, reduced evapotranspiration efficiency, or declining vegetation health. Because these thermal signals often appear before visible symptoms of stress become evident, Sentinel-3 can act as an early indicator for agricultural risk.
A field that exhibits unusually high surface temperature compared to surrounding areas may indicate insufficient irrigation, a soil moisture deficit, or crop stress. This becomes especially powerful when thermal information is combined with vegetation indices derived from Sentinel-2. If Sentinel-2 indicates reduced vegetation vigour through lower NDVI values, and Sentinel-3 simultaneously shows elevated surface temperatures in the same region, the combined interpretation strongly suggests active stress conditions affecting the crops. This type of multi-source integration allows agricultural monitoring to move from simple observation toward more robust diagnostic analysis.
Drought monitoring represents a particularly important application. At regional scale, OLCI contributes by monitoring crop cycles and biomass trends, providing the broader vegetation context within which thermal anomalies can be interpreted. Surface temperature anomalies often precede the visible degradation of vegetation condition. This means thermal monitoring can act as an early indicator of drought impact. When integrated with meteorological forecast services and soil moisture estimations, Sentinel-3 becomes part of a larger environmental intelligence framework supporting agricultural risk management. By monitoring temperature and moisture levels over time, agricultural managers can anticipate periods of water scarcity and adjust farming practices to reduce the impact.
The latent and sensible heat information is also directly applicable in agricultural management. By comparing these two fluxes across different fields, analysts can assess the efficiency of water use in crops. If a field is producing a large amount of sensible heat and a low amount of latent heat, it could indicate that the crops are under water stress and that transpiration is suppressed. Combined with soil wetness data, these variables allow a nuanced and physically grounded interpretation of crop status.
Broader Environmental Monitoring
Beyond urban and agricultural applications, Sentinel-3 supports a wide range of environmental monitoring activities. Through OLCI, it contributes to the observation of vegetation dynamics over large territories, supporting the monitoring of crop cycles, biomass trends, and ecosystem behavior at scales that Sentinel-2 alone cannot efficiently cover. For urbanization studies, OLCI can contribute to broader land cover interpretation and environmental quality assessment, especially when integrated with higher-resolution datasets.
In coastal and marine environments, sea surface temperature data from SLSTR plays a critical role. Rising sea temperatures can indicate stress on marine ecosystems, including coral bleaching and changes in fish migration patterns. Monitoring the temperature of water bodies also supports the analysis of pollution dynamics and sediment transport in rivers, lakes, and estuaries.
For wildfire monitoring, the ability of Sentinel-3 to detect thermal anomalies allows early identification of active fire events in forests and grasslands, supporting early warning systems and rapid response efforts. Surface temperature and thermal radiation data also contribute to climate research, enabling the assessment of long-term warming trends and regional climate variability. Combined with historical climate records, these datasets support the modeling of future climate scenarios and inform environmental policy. In all these cases, Sentinel-3 is not simply providing images, but structured measurements of the physical state of the environment.
Visualization in EagleArca
Within the EagleArca platform, Sentinel-3 data is available through two distinct layer types, each serving a different analytical purpose.
The Heat Island Layer
The first is the Heat Island layer. This layer aggregates Sentinel-3 data over an extended period, typically at least one year, and calculates average land surface temperatures across different seasons. This temporal aggregation allows users to identify persistent heat accumulation zones, analyze seasonal temperature patterns, and evaluate long-term trends in urban thermal behavior. Users can compare summer and winter thermal patterns, identify hotspot areas, and examine how these relate to land cover, vegetation density, or infrastructure distribution.
When combined with Sentinel-2 classification data, the Heat Island layer provides a powerful tool for understanding how urban morphology and the distribution of green spaces influence thermal dynamics. The layer also enables the monitoring of long-term trends in urban heat island development, identifying areas that may be getting progressively warmer over the years. Since elevated temperatures promote the formation of pollutants such as ozone, this information is directly relevant for air quality assessment alongside thermal risk evaluation.
The Sentinel-3 Daily Data Layer
The second layer is the Sentinel-3 Daily Data layer. Unlike the aggregated Heat Island product, this layer is updated every time new data from Sentinel-3 becomes available, which is typically every 24 hours, providing near-real-time access to environmental variables. These include land surface temperature, latent heat, sensible heat, soil wetness, and wind components, as well as atmospheric parameters such as specific humidity, solar radiation, ozone, and water vapor. For coastal areas, sea surface temperature is also included, which is important for understanding oceanic processes and climate-related phenomena.
This daily update capability makes the layer particularly valuable for dynamic decision-making. Farmers can monitor evolving thermal and moisture conditions. Urban managers can track heat accumulation during heat waves. Environmental analysts can follow atmospheric dynamics in near real time. The key value of both layers within EagleArca is not simply visualization, but integration. Because all layers within the platform are georeferenced within the same coordinate system, Sentinel-3 products can be seamlessly combined with Sentinel-2 classification, Digital Elevation Models, infrastructure layers, or meteorological datasets. This spatial consistency transforms what might otherwise be disconnected measurements into a coherent and interpretable view of the environment.
Integration with Other Sentinel Missions
One of the most important conceptual points about Sentinel-3 is how it fits within the broader Copernicus ecosystem. Sentinel-3 is not a replacement for Sentinel-1 or Sentinel-2. Rather, it contributes a different and complementary dimension to the overall observational framework.
Sentinel-2 provides spatially detailed multispectral observations at ten-meter resolution, enabling field-level analysis of vegetation, soil, water, and urban surfaces. Sentinel-3 provides the thermal and environmental context that helps explain many of the patterns visible in Sentinel-2 data. When crops show anomalous spectral behavior in Sentinel-2, Sentinel-3 thermal and moisture data can help diagnose whether the cause is heat stress, water deficit, or some other environmental factor.
When urban areas show dense built-up patterns in Sentinel-2 classification, Sentinel-3 can reveal the thermal consequences of that urbanization. Sentinel-1, meanwhile, contributes structural and deformation information through radar observation, working independently of cloud cover. Together, the three missions create a much richer understanding of the territory than any single system could provide.
A critical aspect of interpretation is also understanding the scale at which Sentinel-3 operates. Its spatial resolution is coarser than that of Sentinel-2, but this is compensated by broader coverage and strong temporal consistency. Sentinel-3 is not the right tool for identifying individual buildings or narrow agricultural rows. However, it is extremely effective for understanding large-scale environmental processes: heat distribution across metropolitan areas, drought evolution across agricultural regions, vegetation dynamics over large ecosystems, and temperature anomalies at continental scale.
The Role of Sentinel-3 in Modern Earth Observation
Sentinel-3 is a mission designed not simply to observe the Earth visually, but to measure the physical state of the environment. Through its instruments, particularly SLSTR and OLCI, it provides critical information about surface temperature, vegetation dynamics at regional scale, atmospheric composition, environmental stress, and climatic behavior.
Its applications in urbanization include heat island analysis, environmental quality assessment, urban climate resilience studies, and the long-term monitoring of thermal patterns. In agriculture, Sentinel-3 supports drought monitoring, early detection of thermal stress, crop condition assessment, and water management evaluation. In environmental science, it contributes to coastal analysis, wildfire detection, ecosystem monitoring, and climate research.
When integrated with Sentinel-1, Sentinel-2, elevation models, meteorological services, and GIS-based platforms such as EagleArca, Sentinel-3 becomes part of a comprehensive environmental monitoring ecosystem capable of supporting both operational analysis and long-term decision-making. Ultimately, Sentinel-3 demonstrates how modern satellite systems are evolving beyond simple imaging toward continuous, multidimensional observation of the Earth system, enabling us to better understand the complex interactions between climate, environment, human activity, and territorial dynamics.
Sentinel-5P
Click here to download the PDF
Sentinel-5P in the Copernicus Ecosystem
Welcome. In this video, we explore Sentinel-5P, the atmospheric monitoring mission of the Copernicus Earth Observation Programme. The Copernicus programme includes a family of satellite missions, each focused on a different aspect of Earth observation. Sentinel-1 focuses on radar observations of the surface. Sentinel-2 provides high-resolution multispectral optical imagery of land cover. Sentinel-3 observes large-scale environmental dynamics, including surface temperature and ocean conditions. Sentinel-5P addresses a fundamentally different domain: the composition of the atmosphere itself.
Operational since 2017, Sentinel-5P is dedicated to delivering high-precision, global measurements of key atmospheric constituents, including both pollutants and greenhouse gases. Its data supports applications in air quality management, climate research, urban planning, and agriculture. While the other Sentinel missions primarily observe what is on or near the surface, Sentinel-5P observes what is above it, providing the atmospheric dimension of environmental intelligence within the Copernicus programme.
The TROPOMI Instrument
At the core of Sentinel-5P is the TROPOMI instrument, which stands for Tropospheric Monitoring Instrument. TROPOMI is an advanced spectrometer capable of measuring the concentration of a wide range of atmospheric components across the entire globe. Its spatial resolution of approximately seven by seven kilometers makes it one of the most detailed atmospheric sensors currently in orbit. Unlike earlier instruments that focused on specific gases or geographic regions, TROPOMI provides continuous global coverage and delivers a comprehensive view of atmospheric composition on a daily basis.
The components measured by TROPOMI include ozone, nitrogen dioxide, methane, carbon monoxide, sulphur dioxide, formaldehyde, aerosols, particulate matter, and water vapor. Each of these plays a specific role in atmospheric chemistry, air quality, and climate dynamics. Together, they form a complete picture of atmospheric state that no single previous instrument could provide with this level of spatial detail and global consistency. This breadth of measurement is what makes Sentinel-5P uniquely valuable within the Copernicus architecture.
Atmospheric Components Monitored by Sentinel-5P
Nitrogen Dioxide, Sulphur Dioxide, and Formaldehyde
Nitrogen dioxide, or NO2, is one of the primary pollutants tracked by Sentinel-5P. It is produced mainly by combustion processes, including vehicle emissions, industrial activity, and fossil fuel combustion. Elevated NO2 concentrations are most commonly found in urban environments, where transportation and energy consumption are concentrated. Beyond its direct health effects, which include respiratory and cardiovascular problems, NO2 plays a key role in the formation of ground-level ozone through chemical reactions with other atmospheric compounds in the presence of sunlight.
Sulphur dioxide, or SO2, is emitted by volcanoes, power plants, and various industrial processes. It is harmful to respiratory health and also reacts in the atmosphere to form acid rain, which can damage ecosystems and infrastructure. Monitoring SO2 concentrations is therefore particularly valuable in regions with active volcanic activity or significant industrial emissions. Formaldehyde, or HCHO, is another pollutant measured by TROPOMI. It is a significant precursor of ground-level ozone and a contributor to atmospheric pollution in industrial areas. Monitoring formaldehyde is essential for understanding the chemical dynamics of atmospheric pollution and the processes that drive ozone formation.
Methane and Carbon Monoxide
Methane, or CH4, is one of the most important greenhouse gases tracked by Sentinel-5P. Despite being present in the atmosphere in smaller quantities than carbon dioxide, methane has a significantly higher warming potential. Emissions originate from a variety of sources, including livestock farming, rice paddies, landfills, and oil and gas production. By detecting methane hotspots at global scale, Sentinel-5P provides critical data for climate modeling and emissions monitoring, enabling policymakers to identify emission sources and target mitigation efforts more effectively.
Carbon monoxide, or CO, is a colorless, odorless gas produced mainly by combustion processes, including wildfires, biomass burning, and fossil fuel use. Measuring CO concentrations across large areas provides insights into both urban pollution levels and large-scale combustion events. Historical CO data, for instance, allows researchers to track changes in the intensity of wildfires and the impact of biomass burning events over time, making it a valuable variable for both air quality assessment and climate research.
Ozone: Stratospheric and Tropospheric
Ozone, or O3, plays a dual role in the atmosphere and must therefore be interpreted carefully depending on where it is found. In the stratosphere, the ozone layer absorbs harmful ultraviolet radiation, protecting life on Earth. This protective function makes stratospheric ozone monitoring important for assessing the long-term health of the ozone layer. At ground level, however, ozone is a harmful secondary pollutant. It is formed when nitrogen dioxide and volatile organic compounds react in the presence of sunlight, contributing to smog and causing adverse effects on both human health and vegetation. Sentinel-5P monitors both stratospheric and tropospheric ozone, providing data to track ozone layer conditions while also identifying areas where surface ozone poses a risk to health and ecosystems.
Aerosols, Particulate Matter, and Secondary Aerosols
Aerosols are fine particles suspended in the atmosphere, originating from dust storms, wildfires, volcanic eruptions, and industrial emissions. They have significant effects on both climate and air quality, influencing cloud formation, reflecting solar radiation, and altering the Earth’s energy balance. Sentinel-5P measures aerosol optical thickness, or AOT, in both the near-infrared and shortwave infrared spectral bands. AOT is a dimensionless coefficient that quantifies the amount of aerosol present in the atmosphere: higher values indicate higher concentrations. These measurements are particularly valuable for climate modeling, as they help scientists understand how aerosols interact with incoming solar radiation and affect cloud formation processes, two factors that directly shape the energy exchange between the atmosphere and the surface below.
The size distribution of aerosol particles is also analyzed, since particles of different sizes behave differently in the atmosphere. Fine aerosols can remain suspended and travel longer distances, while larger particles tend to settle more quickly, a distinction that matters both for air quality assessment and for understanding the geographic reach of pollution events. Sentinel-5P also provides data on secondary inorganic aerosols, including sulfates, nitrates, and ammonium. These compounds are formed in the atmosphere through chemical reactions between gases such as sulphur dioxide and nitrogen oxides with water vapor. Monitoring them allows a more complete understanding of how pollution sources contribute to overall atmospheric composition.
Particulate matter, classified by size as PM10 and PM2.5, is another critical variable. Fine particles are of particular concern because they can penetrate deep into the lungs and enter the bloodstream, contributing to respiratory and cardiovascular diseases. Estimated concentrations, expressed in micrograms per cubic meter, help assess pollution levels across urban and rural environments, guide public health responses, and inform the design of air quality regulations aimed at protecting the most vulnerable populations.
Water Vapor
Water vapor is the most abundant greenhouse gas in the atmosphere and plays a fundamental role in weather and climate dynamics. Sentinel-5P measures total column water vapor, or TCWV, which describes the total amount of water vapor integrated vertically through the atmosphere above a given location. This measurement is essential for weather forecasting, as water vapor directly influences cloud formation, precipitation dynamics, and the exchange of energy between the surface and the atmosphere. Beyond its role in climate science, TCWV data also has practical value in agriculture, where understanding atmospheric moisture conditions supports irrigation planning, helps anticipate periods of crop stress caused by water deficit or excess humidity, and improves the management of water resources at the field scale.
Applications in Urban Environments
Urban environments are among the primary areas of application for Sentinel-5P data. Cities concentrate industrial activity, transportation, and energy consumption, making them major contributors to atmospheric pollution. Sentinel-5P provides urban managers and planners with the ability to monitor pollutant concentrations across large areas and identify the zones most affected by poor air quality.
Real-time monitoring of NO2 allows the identification of pollution hotspots, enabling targeted interventions such as traffic restrictions, clean energy transitions, or the expansion of green infrastructure. During high pollution events or wildfire outbreaks, the spatial data from Sentinel-5P allows authorities to rapidly identify affected areas and implement timely mitigation measures to protect public health. During periods of elevated ozone concentration, municipalities can issue health warnings or adjust industrial activity to protect vulnerable populations, particularly children and the elderly. Methane monitoring is also directly relevant in urban contexts, where leaks from natural gas pipelines or storage facilities can be detected and rapidly addressed, improving both safety and environmental performance.
In the longer term, tracking how pollutant levels evolve over months and years in response to regulatory changes or infrastructure investments allows decision-makers to evaluate the effectiveness of their interventions and refine urban environmental policies accordingly.
Applications in Agriculture
In agricultural contexts, Sentinel-5P data provides important insights into how atmospheric conditions affect crop health and farming sustainability. Ground-level ozone is one of the most direct threats: prolonged exposure to elevated ozone concentrations can damage sensitive crops and reduce yields. Monitoring ozone levels spatially and over time allows agricultural managers to identify areas at risk and adjust harvest schedules or farming practices to minimize damage before it becomes economically significant. More broadly, air quality data from Sentinel-5P can support decisions on irrigation scheduling, soil management, and crop stress assessment, helping farmers anticipate how atmospheric conditions might affect their land and plan accordingly.
Elevated levels of NO2 can also signal atmospheric pollution that affects soil health and crop development, and when sustained over time, such air quality trends can become a direct risk factor for vegetation vitality. By combining Sentinel-5P air quality data with vegetation indices derived from Sentinel-2, agronomists can operationally assess whether areas showing reduced vegetation vigor are also experiencing elevated pollutant concentrations, enabling a more targeted and evidence-based approach to crop management decisions.
Methane monitoring is particularly relevant for understanding emissions from livestock farming and rice paddies. By identifying methane hotspots through Sentinel-5P data, farmers and environmental managers can target areas of excessive emissions and implement measures such as biogas capture systems or adjusted feeding practices to reduce their environmental footprint and contribute to climate mitigation goals.
Climate Research and Environmental Monitoring
Beyond urban and agricultural applications, Sentinel-5P plays an essential role in broader climate and environmental research. Long-term monitoring of greenhouse gases such as methane provides scientists with the data needed to assess emission trends, understand how human activities are altering atmospheric composition, and develop projections for future climate conditions. This long-term observational record is one of the most valuable outputs of the mission, as it transforms individual measurements into a continuous archive of atmospheric change.
Aerosol monitoring contributes directly to climate science, since aerosols influence cloud formation and the Earth's energy balance by reflecting and absorbing solar radiation. Understanding the distribution and concentration of aerosols at different atmospheric levels is essential for improving the accuracy of climate models. In regions affected by intense dust storms, wildfires, or volcanic activity, aerosol data from Sentinel-5P provides situational awareness that supports both scientific analysis and operational response.
Visualization in EagleArca: The Air Quality Layer
Within the EagleArca platform, Sentinel-5P data is made available through the Air Quality layer. This layer provides both real-time and historical atmospheric information, displayed as an interactive two-dimensional map that allow users to observe the distribution of pollutants and track changes in atmospheric conditions over time. Each day, the platform updates the layer with the most recent data available from Sentinel-5P, providing near-real-time access to variables such as NO2, methane, CO, ozone, and SO2 concentrations. This daily update capability is particularly valuable for operational monitoring and public health management. In cases of high pollution events or wildfire outbreaks, the data allows rapid identification of affected areas and supports timely mitigation responses.
Equally important is the access to historical data. As Sentinel-5P continuously acquires atmospheric observations, EagleArca archives this information and makes it available for time-series analysis. Users can examine how pollutant concentrations have evolved over periods ranging from days to years, observe the seasonal progression of ozone or methane on a month-by-month or year-over-year basis, monitor long-term trends in greenhouse gas concentrations across specific regions, and verify whether air quality measures or emissions regulations implemented over time have produced measurable, quantifiable improvements. This depth of temporal context transforms the Air Quality layer from a snapshot tool into a genuine decision-support environment, one capable of sustaining ongoing environmental assessments and informing the next cycle of policy and planning decisions.
Integration with Other Sentinel Missions
Sentinel-5P reaches its full analytical potential when its data is combined with the information provided by other Copernicus missions. Within EagleArca, the Air Quality layer can be overlaid with Sentinel-2 optical imagery and vegetation indices to relate atmospheric pollution patterns to land cover and crop or forest health. For instance, combining NO2 or ozone data from Sentinel-5P with NDVI from Sentinel-2 allows analysts to assess whether areas showing reduced vegetation vigour are also experiencing elevated pollutant concentrations.
Integrating Sentinel-5P data with thermal observations from Sentinel-3 supports the study of how urban heat and atmospheric pollution interact. In dense urban environments, high sensible heat flux and elevated pollutant concentrations often co-occur, compounding their effects on air quality and human comfort. Understanding this relationship is particularly relevant for climate resilience planning, where addressing heat accumulation and air quality together produces more effective outcomes than treating them as separate problems.
Sentinel-5P and the Future of Atmospheric Monitoring
Sentinel-5P represents a critical component of modern Earth observation. Its TROPOMI instrument provides a level of atmospheric detail and global consistency that was not previously available from operational satellite systems. By tracking pollutants, greenhouse gases, aerosols, and additional atmospheric variables at high spatial resolution on a daily basis, it enables continuous environmental monitoring across a wide range of scales, from local pollution events to global climate trends.
When combined with the surface, thermal, and structural information provided by the other Sentinel missions, Sentinel-5P contributes the atmospheric dimension to a comprehensive and multi-layered picture of the Earth system. Together, these missions demonstrate how modern satellite infrastructure is enabling a new generation of integrated environmental intelligence, capable of supporting informed decision-making across air quality management, agricultural sustainability, urban planning, and climate science.
ECMWF
Click here to download the PDF
ECMWF and the Copernicus Ecosystem
Welcome. In this video, we explore the significance of weather forecasting and climatic condition monitoring within the context of satellite systems and ECMWF, the European Centre for Medium-Range Weather Forecasts. The global need for accurate weather predictions is growing, driven by climate change, agricultural dependencies, and disaster preparedness. Understanding the systems that deliver these forecasts has therefore become crucial for many industries, including agriculture, urban planning, and emergency response. ECMWF produces some of the world's most accurate weather models and represents a pivotal component of climate research and weather prediction. Its medium-range forecasts are among the most reliable global predictions available. Its strength lies not only in short-term forecasting, but also in its ability to model the atmosphere and the climate system with a medium-term horizon, helping meteorologists understand weather patterns and phenomena over longer timeframes.
This capability is built on a global numerical weather prediction model that uses vast amounts of data from satellites, weather stations, and radiosondes, which are balloon-borne instruments, to simulate atmospheric conditions. These data sources provide real-time observations of temperature, humidity, wind speed, cloud cover, and precipitation, all feeding into ECMWF's models. The system produces global weather forecasts for up to fifteen days ahead.
Satellite Data in ECMWF Weather Forecasting
Satellite data plays a vital role in ECMWF's predictions. Satellites from the Copernicus Programme, including Sentinel-1, Sentinel-2, and Sentinel-3, provide comprehensive data about the Earth's surface, oceans, and atmosphere. They allow global observation of climatic conditions by tracking key variables such as sea surface temperature, snow cover, airborne pollutants, and vegetation conditions. All of these are essential inputs for climate modelling and the monitoring of long-term climatic trends. Sentinel-1 helps monitor surface deformations and flooding, and its observations are also useful for analysing geophysical phenomena and potential risks related to seismic activity. Sentinel-2 offers high-resolution multispectral imagery to track vegetation health, soil moisture, and land use.
Sentinel-3 provides thermal and oceanographic data, supporting a better understanding of sea temperature and the effects of thermal radiation on the Earth's climate. Integrating data from all these satellites with ECMWF's models greatly improves the accuracy of weather forecasts and climate projections. For day-to-day forecasting, ECMWF models use data gathered by both polar-orbiting and geostationary satellites. Polar-orbiting satellites, such as those in the MetOp series, orbit the Earth at different latitudes and capture high-resolution measurements across the entire planet. Geostationary satellites, such as MSG and Himawari, continuously observe the same area of the Earth, enabling real-time monitoring of weather systems like hurricanes, storm fronts, and cloud formations.
The combination of both types is crucial. Polar-orbiting satellites provide global atmospheric measurements at higher resolution, while geostationary satellites deliver real-time information on rapidly changing weather systems. Together, they ensure both global coverage and high temporal resolution. For long-term climate monitoring, ECMWF uses satellite data to assess climatic trends over time. Sea surface temperature, or SST, is a major climatic variable for studying ocean circulation and its influence on weather patterns. By incorporating satellite observations of SST into climate models, ECMWF can better predict large-scale weather phenomena like El Niño or La Niña, which significantly affect global rainfall and temperature distributions.
Weather Variables in the EagleArca Platform
The Weather service available on the EagleArca platform provides daily updates on a wide range of atmospheric variables. These measurements are crucial for understanding both immediate and longer-term environmental factors, affecting everything from urban planning to agriculture. The following sections describe each variable category and its significance.
Precipitation, Soil and Runoff
Rain, measured in millimetres, indicates the amount of precipitation that has fallen over a specific period. It is an essential metric for understanding weather patterns, drought conditions, and irrigation needs. Total Precipitation extends this measurement to include all types of precipitation, such as rain, snow, hail, and sleet. This provides a more comprehensive view of how weather interacts with the environment, especially in areas prone to mixed precipitation types.
Runoff, also measured in millimetres, indicates the amount of water that flows over the land surface and can potentially contribute to flooding. This variable is particularly useful for managing urban drainage systems and agricultural irrigation, and for assessing the risk of soil erosion. Soil moisture and soil temperature, labelled in the platform as soil_moist and soil_tempe, provide real-time data on soil conditions. They are key for monitoring irrigation needs, predicting drought conditions, and managing crop health. Finally, snowfall and snow depth are also provided, completing the picture of precipitation and its accumulation on the surface.
Temperature and Humidity
Temperature, measured in degrees Celsius, provides a snapshot of the thermal state of the atmosphere. Surface temperature indicates the temperature of the land surface specifically. It is important in both urban heat island studies and agriculture, where it helps assess crop development, frost risks, and heat stress. Relative humidity, expressed as a percentage, refers to the amount of moisture in the air relative to the maximum the air can hold at a given temperature. It is a key determinant of perceived comfort and directly influences the rate of evapotranspiration in crops, which makes it essential for managing water resources in agriculture.
The dew point, in degrees Celsius, is the temperature at which air becomes saturated with moisture and water vapour begins to condense. It is important for predicting fog formation and frost. In agriculture, dew point data provides early warnings about frost risks that are critical for protecting crops. Apparent temperature, also in degrees Celsius, represents the temperature as perceived by the human body. It accounts for both air temperature and humidity, and is especially relevant in urban heat island studies, where dense building structures and fewer green spaces can lead to higher perceived temperatures.
Pressure and Wind
The platform provides two pressure readings. Mean sea-level pressure, labelled in the platform as pressure_m, is expressed in hectopascals and corrected for altitude. It helps interpret large-scale weather systems: low-pressure systems are associated with storms and bad weather, while high-pressure systems correspond to clear skies and stable conditions. Surface atmospheric pressure, labelled as surface_pr, determines local weather conditions and wind patterns.
Wind speed and wind direction, labelled in the platform as wind_speed and wind_direction, are crucial for understanding weather systems and air quality. Wind affects the distribution of pollutants, moisture, and heat, particularly in urban areas and agricultural regions where airflow influences irrigation, pesticide application, and heat accumulation. Wind data also helps predict the movement of weather fronts and storm systems, and is important for industries such as aviation, shipping, and renewable energy, specifically wind power.
Cloud Cover and Atmospheric Instability
Cloud cover, expressed as a percentage, indicates how much of the sky is covered by clouds and directly affects solar radiation, temperature, and precipitation. It is also useful for predicting weather changes, such as the development of storms or the transition to clear sky conditions. The platform provides cloud fraction values broken down by altitude, labelled as cloud_co_1, cloud_co_2, and cloud_co_3, representing low, middle, and high-level clouds respectively. This layered view provides a deeper understanding of atmospheric conditions at different altitudes, supporting weather forecasting and climate modelling.
CAPE, measured in joules per kilogram, stands for Convective Available Potential Energy and is a measure of atmospheric instability. It quantifies the potential energy in the atmosphere that can fuel storm development. The higher the CAPE value, the greater the likelihood of severe weather events such as thunderstorms, hail, and tornadoes.
Atmospheric Column Variables
Total column water vapour measures the total amount of water vapour integrated vertically through the atmosphere above a given location. Water vapour is the primary greenhouse gas and plays a central role in the Earth's water cycle, influencing precipitation patterns, cloud formation, and energy transfer. Total column ozone is crucial for understanding both the health of the stratospheric ozone layer and the presence of ground-level ozone, which is a significant air pollutant.
Applications in Agriculture
Weather forecasting and climate data are vital for the agriculture sector. With Sentinel-2 data, farmers can monitor vegetation health using vegetation indices like NDVI and EVI, derived from satellite reflectance in the red and near-infrared bands. These indices provide early warnings about crop health. They help farmers decide when to irrigate, how to manage pest pressure, and how to optimise water use across the growing season. Temperature forecasting is equally critical, especially when linked with frost prediction or heat stress. Sentinel-3 land surface temperature data allows agricultural decision-makers to anticipate temperature anomalies that could harm crops, offering more time for preparation and mitigation.
The EagleArca platform's daily updates on rainfall, humidity, and soil conditions allow farmers to continuously assess drought and flood risks and plan for pest management. The data also supports protection of crops from frost, heat stress, and other weather-related damage. The platform enables tracking of seasonal weather patterns as they evolve, supporting adjustments for climate-related risks and the optimisation of water resources across the growing season.
Applications in Urban Environments
In urban environments, weather forecasting and climate models are essential for managing heat islands. The Urban Heat Island effect occurs when built-up areas experience significantly higher temperatures than surrounding rural areas, primarily due to impervious surfaces such as roads and buildings that absorb heat. By combining ECMWF weather forecasts with Sentinel-3 land surface temperature data, cities can identify areas subject to heat accumulation and implement cooling strategies, such as increasing urban green spaces or using reflective materials on roads. The platform also supports the analysis of how green spaces, rooftops, pavement, and urban structures influence local microclimates, helping planners design more resilient environments and reduce heat-related health risks for urban populations.
ECMWF's data also supports air quality management and infrastructure planning in cities. By incorporating aerosol and pollutant data from Sentinel-5P and other Copernicus missions, urban planners can assess pollution sources, track NO2 levels, and evaluate strategies to reduce emissions and improve air quality. Rainfall and runoff data further support the planning of urban drainage systems, helping cities manage flood risk and prevent waterlogging in built-up areas.
Disaster Management and Climate Research
Real-time weather data plays a key role in disaster management. During events such as floods, heatwaves, or wildfires, the EagleArca platform can be used to track temperature fluctuations, precipitation intensity, and wind direction, providing crucial information for emergency responders. The ability to view these changes in real time enables faster decision-making and better resource allocation during critical situations.
For climate research, the long-term availability of historical weather data through EagleArca allows scientists to observe changes in climatic conditions over time, track seasonal patterns, and model future environmental changes. This data, combined with datasets such as Sentinel-1 for monitoring land subsidence or Sentinel-2 for tracking vegetation health, contributes to a comprehensive understanding of how climate change is impacting specific regions.
Visualization in EagleArca: The Weather Service
The Weather service on EagleArca provides real-time weather data refreshed daily, offering a comprehensive view of atmospheric conditions across large spatial areas. The data is sourced from advanced satellite systems and atmospheric monitoring instruments, ensuring high accuracy and global coverage. Within the platform, weather variables are visualized through the 2D view, providing an intuitive, map-based interface where users can observe the spatial distribution of atmospheric parameters. By zooming in on different geographic areas, users can track specific trends in detail, from precipitation patterns to temperature anomalies and wind dynamics. This view also helps urban planners identify where heat is accumulating and understand how elements such as green spaces, rooftops, pavement, and urban structures influence local microclimates.
The daily refresh of data ensures that users are always working with the most current atmospheric measurements, without the delays of manual reporting or outdated weather stations. This continuous update cycle improves the accuracy of forecasts, enables more reliable weather alerts, and better prepares users for extreme events such as heavy rainfall, windstorms, heatwaves, floods, and wildfires. Alongside real-time updates, EagleArca archives historical weather data, allowing users to access and analyze atmospheric conditions over extended time periods.
This makes it possible to track seasonal patterns, observe multi-year climate trends, and evaluate how specific weather events have evolved across a region. Combined with daily updates, the Weather service becomes a complete decision-support environment, whether for managing irrigation in agriculture, monitoring heat accumulation in cities, or coordinating responses to extreme weather events.
ECMWF and Copernicus: An Integrated Framework
ECMWF's weather and climate models are central to improving weather forecasts and understanding atmospheric conditions on both global and regional scales. The integration of satellite data from Copernicus missions like Sentinel-1, Sentinel-2, and Sentinel-3 with ECMWF's predictive capabilities provides an essential toolset for addressing a wide range of environmental challenges. From agriculture to urban planning and disaster preparedness, this integrated approach enhances our ability to make data-driven decisions that improve resilience to climate extremes and support sustainable development. As satellite systems and predictive modelling continue to improve, the combination of ECMWF's meteorological capabilities and Copernicus satellite data will play an increasingly important role in shaping the future of climate resilience and environmental management globally.
Satellite Urbanization Service
Click here to donwload the PDF
Satellite Urbanization Service
Welcome. In this video, we explore a practical example of how satellite-derived analytics and geospatial intelligence can be transformed into a concrete decision-support tool for urban planning and territorial resilience. The objective is to understand how Earth observation can move beyond simple visualization and become a multidimensional framework for understanding how a territory actually behaves. To do this, we will not treat the city as a static picture seen from above, but as a physical system that can be measured. A satellite image of a city may show buildings, roads and green spaces, but on its own it tells us little about how that environment is changing or where it is vulnerable. The Urbanization service is designed to go much further.
We will follow a comprehensive urban risk and resilience analysis generated over a complete Area of Interest, often abbreviated as AOI. Within this area, thousands of individual spatial cells are processed, each one carrying environmental, urban, climatic and geotechnical information. The result is not a single map, but a layered portrait of the city as a living system. In the following sections, we will look at what this service examines, which satellite data it relies on, what kind of results it produces, and finally how all of this information is visualized and explored within the EagleArca platform. And throughout, one idea will return constantly: none of these indicators stands alone. Their real value emerges only when they are read together.
What the Service Examines
The Urbanization service is built around a simple but powerful idea: a city is a physical system, and like any physical system, it can be described through measurable variables. Rather than focusing on a single aspect, the service examines the urban environment across several complementary dimensions, because urban risk and resilience never depend on one factor alone.
The first dimension is what physically exists inside the territory: how much of it is vegetation, soil, built environment or water. This is the necessary starting point, because urban risk is not interpreted in the same way in a forested landscape, an agricultural region or a dense city. The second dimension is the physical extent of the city and how it changes over time. Urban growth is not uniform. In some places development fills the gaps inside existing neighbourhoods; in others it expands along the edges of the city, or appears as scattered, isolated patches far from the existing urban fabric. Each of these patterns has very different consequences for infrastructure and for the surrounding landscape.
The third dimension concerns the surfaces of the city and their environmental behaviour. Artificial materials such as asphalt and concrete do not behave like soil or vegetation. They prevent water from infiltrating into the ground, they absorb and store heat, and they alter the local climate. The service therefore examines how sealed the urban surface is, how much green space remains, and how these factors influence both water management and thermal conditions. The fourth dimension is thermal behaviour: the tendency of cities to become warmer than the rural areas around them, with direct consequences for energy demand, public health and comfort.
The fifth dimension is environmental and atmospheric pressure: the quality of the air over the urban area, and the broader climatic stress to which the city is subjected, combining the effects of heat and precipitation. And the final dimension is the stability of the ground itself and the city's exposure to water-related risk: whether the terrain is slowly sinking or shifting beneath buildings and infrastructure, and where water is likely to accumulate during intense rainfall. Taken together, these dimensions describe not just where the city is, but how it lives and where it is fragile.
What Data the Service Uses
To examine these many dimensions, the Urbanization service does not rely on a single satellite. It integrates observations from several missions of the European Union's Copernicus programme, each contributing a different and complementary physical measurement. This is fundamental, because no single sensor can capture the full complexity of an urban environment. Optical imagery, radar backscatter, thermal emission and atmospheric chemistry all describe different physical aspects of the same territory, and the real power lies in fusing them into a single coherent picture.

The first essential source is Sentinel-2, the optical multispectral mission. Sentinel-2 does not simply produce images; it measures how the Earth's surface reflects solar radiation across thirteen spectral bands, from the visible to the short-wave infrared. Because different materials, such as vegetation, soil, water and artificial surfaces, reflect radiation in characteristic ways, this multispectral information allows each part of the territory to be classified into land-cover categories. This classification is the foundation of the entire service: it is what allows us to distinguish buildings from vegetation, to measure how much of the area is artificial, and to track how that proportion changes over time. Sentinel-2 also provides the vegetation information used to assess urban green coverage, and its detailed spatial resolution makes it possible to follow urban patterns at the scale of individual neighbourhoods.

The second source is Sentinel-3, and in particular its thermal observation capability. Unlike optical sensors that measure reflected sunlight, Sentinel-3 measures the radiation that surfaces themselves emit, which makes it possible to estimate the physical temperature of the ground, known as Land Surface Temperature. This is exactly what is needed to study the urban heat island effect, mapping where heat accumulates and identifying the most thermally vulnerable zones.

The third source is Sentinel-5P, the atmospheric monitoring mission. Its TROPOMI instrument, the Tropospheric Monitoring Instrument, measures the concentration of pollutants and other atmospheric components across the globe. In the urban context, this provides the basis for assessing air quality, since cities concentrate the traffic, industry and energy consumption that drive pollution.

The fourth source is Sentinel-1, the radar mission. Because radar is an active sensor that emits its own microwave signal, Sentinel-1 can observe the surface regardless of cloud cover or daylight. Its most powerful contribution to the urban context comes from interferometry, a technique that compares radar acquisitions over time to detect extremely small movements of the ground, on the order of millimetres. This is what allows the service to measure subsidence, the slow sinking or shifting of the ground, and to assess the stability of the terrain beneath buildings and infrastructure.
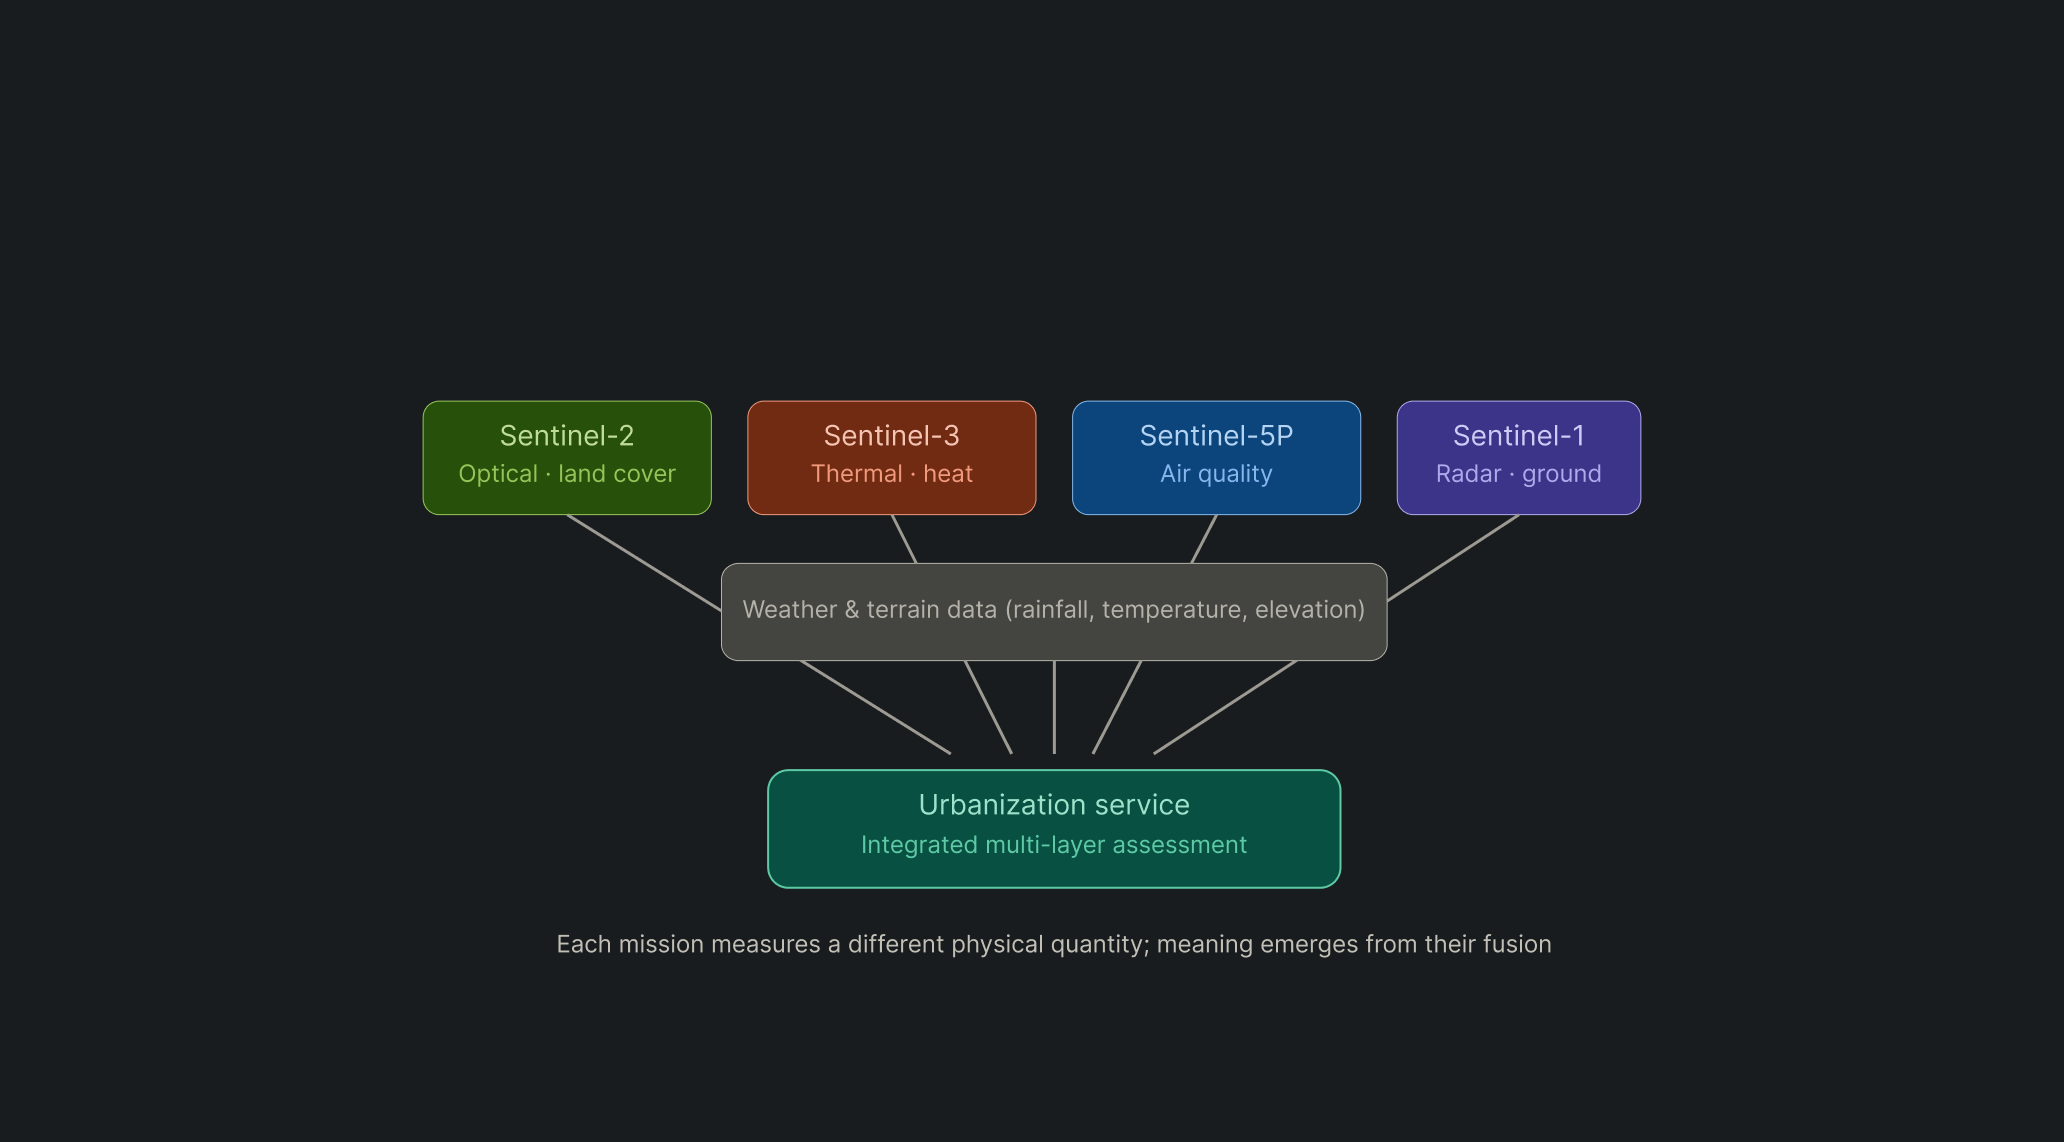
Finally, the service integrates meteorological and climatic information, such as rainfall and temperature, together with terrain data such as elevation models. This information is essential for the climate stress and flood-related components, where the shape of the land and the intensity of precipitation combine with the urban surface to determine risk. The strength of the service lies precisely in this integration. Each mission measures a different physical quantity, and only by combining them does a complete picture of the urban environment emerge.
Applied Results
Once these data sources are combined and processed, the service produces a structured set of indicators that describe the state of the urban environment and its exposure to risk. Let us walk through them in a logical order, and at each step look not only at what is measured, but at why it matters.
Land Classification

The analysis begins with a fundamental layer: land classification. Before evaluating risk or resilience, it is necessary to understand what physically exists inside the territory. Through satellite-based classification algorithms, every cell inside the area is assigned to a macro class such as vegetation, soil, building or water. In this specific analysis, vegetation represents the dominant component of the territory, followed by soil and then buildings, while water occupies only a minimal fraction of the area. This first classification may appear simple, but it establishes the context for every subsequent analysis. Land cover becomes the first explanatory variable for everything that follows: vegetation affects temperature regulation, infiltration capacity and ecological resilience, while built surfaces influence how runoff is generated and how heat accumulates.
Urban Footprint and Urban Growth

From this foundation, the analysis moves to the urban footprint. It estimates the amount of built-up area and artificial coverage inside the AOI. In this case, approximately 4.8 square kilometres are classified as built-up, with artificial surfaces covering around nineteen percent of the territory. But static urban extent alone does not tell the full story, because cities evolve dynamically. The analysis therefore investigates urban growth by comparing built-up patterns over time. Interestingly, in this area it identifies a negative urban expansion value. This does not necessarily mean the city is shrinking; it may indicate either a real contraction or differences in classification between the time intervals being compared. At the same time, hotspot detection identifies specific localized areas where a genuine change from non-built-up to built-up conditions has occurred.

This introduces an important urban planning concept: growth typology. Not all urban growth occurs in the same way. The analysis distinguishes between infill development, which fills the gaps inside existing urban areas; edge expansion, which extends growth along existing boundaries; and leapfrog development, which appears as isolated patches disconnected from the existing urban fabric. In this area, leapfrog growth dominates. From an urban planning perspective, leapfrog growth is often considered problematic, because development in isolated patches frequently increases infrastructure costs, creates transportation inefficiencies and leads to environmental fragmentation. By contrast, compact growth and infill development are usually considered far more sustainable.
Impervious Surfaces and Green Coverage

The next indicator is one of the most operationally relevant: impervious surface estimation. In this analysis, approximately fifty percent of the territory exhibits the characteristics associated with paved or low-infiltration surfaces. Impervious surfaces fundamentally alter the hydrological behaviour of the landscape: rainwater that would naturally infiltrate into the soil instead becomes surface runoff, increasing pressure on drainage systems and elevating flood susceptibility. Consistently with this, the analysis identifies thousands of cells associated with runoff risk.

The analysis then evaluates ecological resilience through green coverage. Vegetation occupies approximately forty-six percent of the area. But urban vegetation is much more than aesthetics. Green areas regulate temperature through evapotranspiration, improve air quality, reduce runoff, support biodiversity and enhance human well-being. In resilient city design, vegetation functions as genuine environmental infrastructure.
Urban Heat Island


This relationship becomes particularly evident with the Urban Heat Island. Heat islands are areas where urbanized surfaces become thermally warmer than the surrounding environment. Here the mean urban heat island intensity is relatively moderate, although the vulnerability zones vary substantially across the area. Heat islands are one of the clearest examples of how urban morphology influences local climate: materials such as asphalt and concrete absorb solar radiation during the day and release it slowly at night, while reduced vegetation and limited airflow amplify the phenomenon. Excessive urban heat affects energy demand, public health and environmental comfort, and it concentrates precisely where vegetation is scarce and impervious coverage is high.
Satellite-Based Air Quality

The analysis then integrates atmospheric observations through a satellite-based air quality index. Composite air quality values and pollution distributions are estimated spatially across the entire AOI. This introduces an important principle: urban environments should not be evaluated only through physical infrastructure. Environmental quality must also be considered, because air quality directly influences public health, urban attractiveness and long-term sustainability. Mapping pollution spatially, rather than relying on a single average, is what reveals local pressures where they actually occur.
Climate Stress

The next indicator moves towards climate adaptation through the Climate Stress Index. This metric combines deviations in heat and precipitation behaviour to identify stressful conditions relative to a baseline, and it also estimates the frequency of heatwave conditions. Climate stress indicators are increasingly important because urban systems are now exposed to growing climatic uncertainty, and infrastructure designed under historical climatic assumptions may not perform adequately under future conditions.
Subsidence and Ground Stability

The analysis then enters the geotechnical domain through subsidence analysis. Ground movement, derived from satellite interferometric observations, reveals the vertical displacement behaviour of the terrain and the associated infrastructure risk classes. Subsidence is one of the most powerful examples of what satellite monitoring can achieve: deformation at the scale of millimetres can be observed consistently over very large territories. This is extremely valuable for transportation networks, historical city centres, pipelines and urban infrastructure management, where even slow ground movement can have serious consequences over time.

Ground stability analysis complements this by classifying stability conditions across the area and identifying alert zones, where deformation anomalies deserve additional investigation. In this analysis, thousands of alert cells are identified. Together, subsidence and ground stability describe not only how much the ground is moving, but where that movement could threaten the built environment.
Flood Susceptibility

Finally, the analysis concludes with one of the most integrated assessments of all: flood susceptibility. Flood risk is not treated as a single parameter, but as the result of multiple interacting variables, including terrain morphology, drainage behaviour, surface imperviousness and rainfall.

To support this, several classical hydrological descriptors are introduced. A Digital Elevation Model describes the shape of the terrain and controls the direction in which surface water flows and where it accumulates. Flow accumulation maps represent how many upstream cells drain into each location, highlighting where runoff naturally converges. Slope calculations describe terrain steepness, since steeper slopes promote rapid drainage while flatter areas allow water to accumulate. The Topographic Wetness Index estimates where water is most likely to remain in the landscape, typically in valley bottoms and poorly drained terrain. And the extracted drainage network approximates the natural channels through which runoff travels.

By combining these descriptors with imperviousness and rainfall, the analysis identifies critical drainage zones, where multiple risk conditions converge simultaneously. These become priority areas for monitoring and mitigation planning, because they are where urban drainage systems are most likely to come under stress during extreme rainfall events.
Visualization in EagleArca
What makes this kind of analysis particularly powerful is not any individual metric on its own. The true value emerges through the integration of heterogeneous geospatial information. Classification, urban growth, heat, air quality, climate stress, subsidence, terrain morphology and flood susceptibility all contribute to a single, multidimensional understanding of how the territory behaves. This reflects the evolution of modern Earth observation systems. Satellite platforms are no longer simply imaging systems. They have become analytical infrastructures, capable of describing environmental, urban and climatic dynamics simultaneously. When these indicators are integrated inside a GIS-based platform such as EagleArca, they become operational tools rather than isolated results.
In EagleArca, each of the indicators we have discussed corresponds to a geospatial layer that can be visualized on the map. Because all layers share the same coordinate system and are georeferenced within the same spatial framework, they can be overlaid and compared directly. This is what turns separate measurements into genuine understanding. A zone of elevated surface temperature can be examined alongside the classification layer to confirm that it corresponds to dense building with little vegetation. An area flagged for ground instability can be overlaid with the built-up footprint to identify which infrastructure is exposed. A critical drainage zone can be read together with the impervious surface layer and the terrain model to understand exactly why water concentrates there. In each case, the meaning comes from the relationship between layers.
From an operational perspective, this supports decision-making for urban planners, infrastructure managers, environmental agencies and resilience strategies. Users can activate and deactivate layers, focus on specific areas of interest, and explore how indicators evolve over time, distinguishing steady trends from sudden changes. Ultimately, this demonstrates how satellite-derived intelligence can transform raw observations into actionable territorial knowledge, enabling cities and regions not only to understand their current conditions, but also to anticipate future vulnerabilities and to support smarter, more resilient planning strategies.
Satellite Agricolture Service
Click here to donwload the PDF
Satellite Agricolture Service
Welcome. In this video, we explore a practical example of how satellite data and geospatial intelligence can support modern agriculture, transforming raw observations into operational knowledge. We often think of agriculture as something that happens only at field level, through tractors, irrigation systems and direct human intervention. However, modern agriculture increasingly relies on large-scale observation systems, capable of continuously monitoring crops, soil conditions, environmental stress and climatic behaviour. This is exactly the philosophy of the Agriculture service: rather than treating a field as something to be inspected only from the ground, it treats the agricultural territory as a living system whose condition can be measured, mapped and followed over time.
To illustrate this, we will follow a comprehensive agricultural risk and resilience analysis generated over a complete Area of Interest, often abbreviated as AOI. Within this area, more than one hundred thousand individual spatial cells are processed, each one carrying information about vegetation, water, soil, heat and atmospheric conditions. The result is not a single map, but a layered portrait of the agricultural landscape. In the following sections, we will look at what this service examines, which satellite data it relies on, what kind of results it produces, and finally how all of this information is visualized and explored within the EagleArca platform. And one idea will return throughout: vegetation health, biomass, moisture, heat, drought, flood risk, terrain deformation, erosion and atmospheric conditions are not independent phenomena. They interact continuously, and their real value emerges only when they are read together.
What the Service Examines
The Agriculture service is built around the idea that a crop behaves like an environmental sensor. Plants respond to water, temperature, nutrients and stress, and these responses can be observed from space before they become visible on the ground. Rather than focusing on a single variable, the service examines the agricultural environment across several complementary dimensions, because agricultural risk never depends on one factor alone.
The first dimension is the health and vigour of the vegetation itself: how actively the crops are growing, and where they are showing signs of stress. Closely related is the amount of vegetation present, the biomass, which acts as a direct proxy for crop productivity and development. The second dimension is water. The service examines how much moisture is present in the soil, where fields are too dry and may require irrigation, and where they are persistently too wet and may suffer from drainage problems. It also looks at how efficiently water is actually used, not simply whether it is present.
The third dimension is hydrological risk within the farmland: the susceptibility of agricultural land to flooding and the identification of drainage convergence zones, because excessive water accumulation can be just as harmful to crops as drought. The fourth dimension is the stability of the terrain. Agricultural systems depend on stable ground for their irrigation infrastructure, canals, access roads and drainage systems, all of which can be affected by slow ground movement. The service therefore examines vertical ground deformation across the agricultural landscape.
The fifth dimension is the long-term sustainability of the soil, through the assessment of erosion susceptibility, since productive topsoil develops over centuries but can be lost rapidly. The sixth dimension is thermal and climatic stress: how often crops are exposed to heat conditions that exceed their optimal range, and how drought develops progressively through the interaction of several environmental signals. Finally, the service examines the pressure that atmospheric pollution places on crops, because air quality and agricultural productivity, once considered separate domains, are in fact deeply interconnected. Taken together, these dimensions describe not just what is growing, but how the agricultural system is performing and where it is fragile.
What Data the Service Uses
To examine these many dimensions, the Agriculture service does not rely on a single satellite. It integrates observations from several missions of the European Union's Copernicus programme, each contributing a different and complementary physical measurement. This is fundamental, because no single sensor can capture the full complexity of an agricultural system. Optical reflectance, thermal emission, radar backscatter and atmospheric chemistry all describe different physical aspects of the same territory, and the real power lies in fusing them.

The first and most central source is Sentinel-2, the optical multispectral mission. Sentinel-2 measures how the surface reflects solar radiation across thirteen spectral bands, from the visible to the short-wave infrared. This is the foundation of crop monitoring, because vegetation has a very characteristic spectral behaviour: healthy plants absorb strongly in the red band, due to chlorophyll, and reflect strongly in the near-infrared, due to the internal structure of their leaves. By combining these bands, the service derives vegetation indices that describe crop vigour and stress, it estimates biomass, and it follows how these change through the growing season. Because Sentinel-2 captures subtle physiological changes before visible symptoms appear, it acts as an early-warning instrument for crop health.

The second source is Sentinel-3, and in particular its thermal observation capability. Sentinel-3 measures the radiation that surfaces themselves emit, which makes it possible to estimate Land Surface Temperature. In agriculture, this is what allows the service to assess crop heat stress, identifying how frequently and how intensely crops are exposed to temperatures beyond their optimal physiological range.

The third source is Sentinel-1, the radar mission. Because radar is an active sensor that emits its own microwave signal, Sentinel-1 observes the surface regardless of cloud cover or daylight. Through interferometry, which compares radar acquisitions over time, it detects ground movement at the scale of millimetres. This is what allows the service to monitor land subsidence across agricultural areas and to identify risk zones for irrigation canals and infrastructure. Radar is also sensitive to surface roughness and soil moisture, adding further information about field conditions.

The fourth source is Sentinel-5P, the atmospheric monitoring mission. Its TROPOMI instrument measures the concentration of pollutants and gases in the atmosphere. In the agricultural context, this provides the basis for assessing how atmospheric pollution pressure may compound crop stress and affect yield.
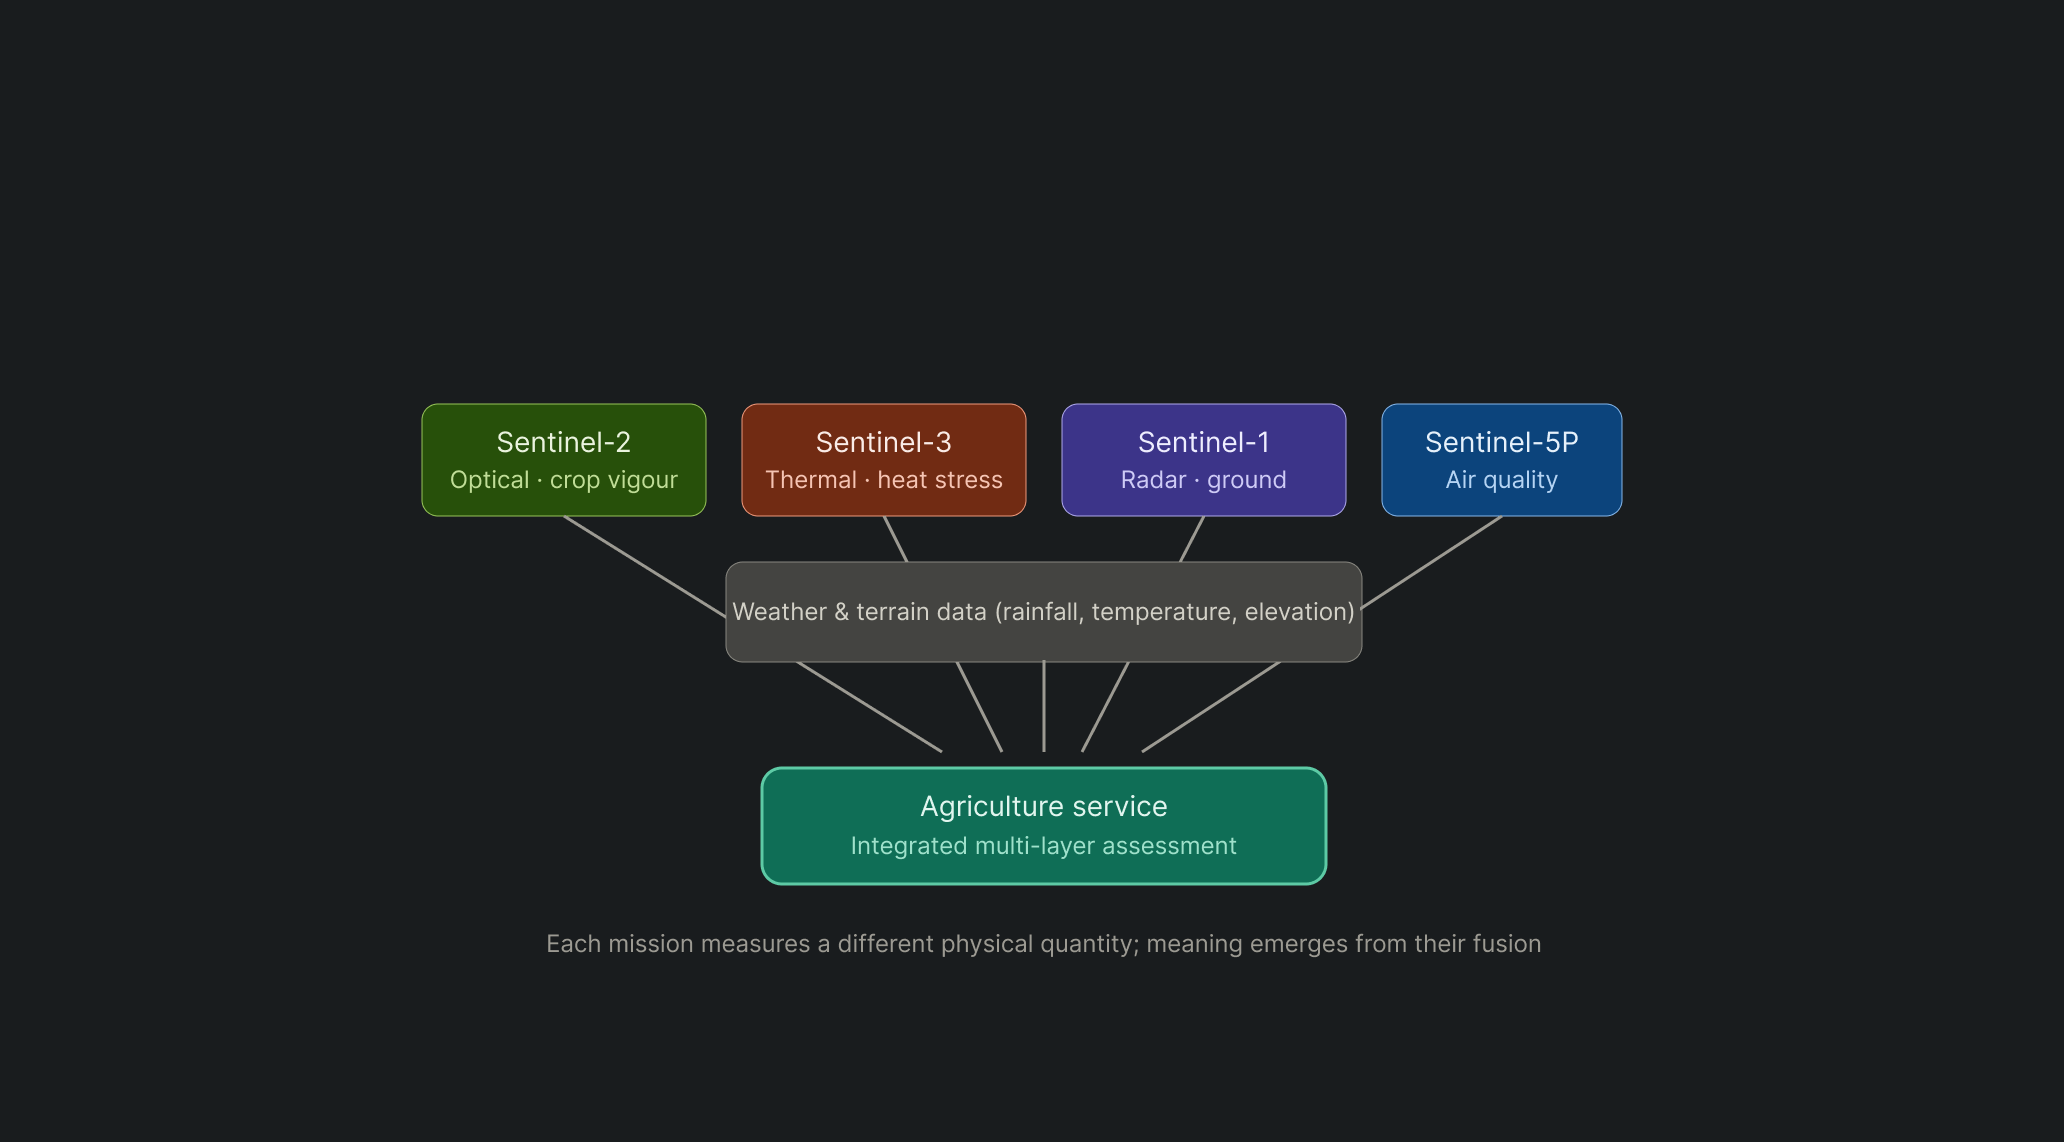
Finally, the service integrates meteorological and climatic information, such as rainfall and temperature, together with terrain data. This context is essential for drought monitoring and for the hydrological and erosion components, where the shape of the land and the behaviour of precipitation combine with crop and soil conditions to determine risk. The strength of the service lies precisely in this integration. Each mission measures a different physical quantity, and only by combining them does a complete picture of the agricultural system emerge.
Applied Results
Once these data sources are combined and processed, the service produces a structured set of indicators that describe the state of the agricultural environment and its exposure to risk. Let us walk through them in a logical order, and at each step look not only at what is measured, but at why it matters.
Vegetation Health

The analysis starts with one of the most fundamental indicators in precision agriculture: vegetation health. Satellite systems continuously monitor the spectral response of vegetation and transform reflectance values into indicators that describe crop vigour and stress. In this report, the average vegetation health index reaches approximately 0.52, while stress anomaly values indicate recurring stress conditions in specific locations across the observed territory. Vegetation health monitoring is one of the most powerful applications of optical satellite imagery, precisely because plants behave like environmental sensors. Healthy vegetation reflects radiation differently from stressed vegetation, so through multispectral acquisitions satellites can observe subtle physiological changes before visible symptoms appear on the ground.

One of the most interesting aspects is the temporal evolution of vegetation behaviour. Rather than providing a static snapshot, the analysis follows crop conditions through multiple acquisition periods, illustrating the fluctuations in vegetation vigour and stress dynamics across the entire year. This temporal perspective is essential, because agricultural systems are dynamic biological processes. A single measurement rarely provides enough information; it is the trends over time that reveal crop cycles, the accumulation of stress, seasonal behaviour and possible anomalies that may require field inspection.
Biomass

The analysis then moves towards biomass estimation. Biomass represents one of the most direct indicators of crop productivity and plant development. Average biomass values indicate the amount of above-ground vegetation present within the observed area, and areas with lower biomass become immediately visible through geospatial mapping. Biomass estimation is particularly valuable because it acts as a proxy for agricultural productivity. Areas showing reduced biomass may indicate nutrient deficiencies, water limitations, disease effects or developmental delays. A temporal accumulation curve further highlights seasonal growth behaviour and reveals how vegetation responds throughout the year.
Soil Moisture

Agricultural management strongly depends on water availability, which leads to the next analytical layer: soil moisture monitoring. The analysis estimates moisture conditions across more than one hundred thousand cells and identifies irrigation optimization zones, where intervention priorities may exist. Soil moisture is one of the most critical variables in agricultural systems, because it controls plant water uptake, nutrient transport, microbial activity and overall crop development. Both excessive dryness and excessive wetness can negatively affect productivity. What makes this analysis particularly useful is that moisture information is transformed into actionable recommendations: dry zones requiring higher irrigation priority become immediately identifiable on maps, while persistent wet zones can instead reveal drainage issues that require attention.
Irrigation Efficiency

The analysis then extends irrigation assessment through efficiency metrics. Irrigation anomaly indicators and a water productivity index attempt to understand not simply whether water is present, but whether it is used effectively. This distinction is important, because sustainable agriculture is not only about increasing water availability; it is about optimizing the use of the resource. Water productivity combines crop response with water input efficiency, supporting precision agriculture practices that reduce waste.
Drainage and Flood Risk

The analysis then shifts towards hydrological risk, through drainage and flood susceptibility assessment in farmland. Agricultural flood risk and critical drainage zones are estimated spatially across the entire territory. Flood susceptibility in agricultural environments is often underestimated. While irrigation shortages receive considerable attention, excessive water accumulation can be equally harmful: saturated soils reduce the oxygen available to roots, damage crop development and increase susceptibility to disease. By identifying drainage convergence zones, satellite analysis can support preventative interventions.
Land Subsidence

The analysis then introduces land subsidence monitoring. Ground displacement measurements, derived from satellite radar interferometry, provide information about vertical movement behaviour across the agricultural landscape, and risk zones for infrastructure and irrigation canals are additionally identified. This may initially appear more relevant to urban environments, but agricultural systems strongly depend on stable terrain. Irrigation infrastructure, water channels, access roads and drainage systems can all be affected by subtle ground deformation. Monitoring displacement at the scale of millimetres allows the early identification of potential infrastructure problems before they become serious.
Soil Erosion
The analysis continues with soil erosion. Erosion susceptibility classes categorize areas according to their vulnerability, while priority intervention zones identify regions that may require mitigation actions. Soil erosion represents one of the greatest long-term threats to agricultural sustainability. Productive topsoil develops over centuries, but it can disappear rapidly due to runoff processes, inappropriate land management and climatic extremes. Understanding where erosion risk accumulates enables targeted conservation measures.
Crop Heat Stress

The next indicator focuses on crop heat stress. Satellite-derived temperature observations identify the frequency and intensity of heat conditions that may affect crops, and vulnerability classifications reveal which areas experience stronger thermal pressure. Heat stress is becoming increasingly important under changing climatic conditions. Plants have optimal physiological temperature ranges, and when temperature exceeds critical thresholds, the efficiency of photosynthesis decreases, transpiration patterns change and productivity declines. The seasonal analysis shows the periods characterized by stronger heat-stress frequency, allowing the identification of the most critical growing periods.
Drought Monitoring

Closely connected to heat is drought monitoring. The analysis integrates multiple environmental signals into a drought severity index, capable of identifying early-warning conditions. Drought rarely emerges suddenly. It develops progressively, through the interaction between precipitation deficits, rising temperatures, moisture depletion and vegetation response. By integrating multiple indicators, satellite systems can provide early signals before severe agricultural impacts become visible. A particularly useful aspect is the temporal decomposition of the drought drivers: rather than delivering only a final severity score, the system analyses how the different components contribute over time.
Multi-Gas Crop Risk

Finally, the analysis introduces an innovative concept: multi-gas crop risk assessment. Here, atmospheric pollution pressure is integrated with vegetation stress analysis to estimate possible effects on agricultural productivity. Traditionally, agriculture and atmospheric quality were considered independent domains. Modern Earth observation demonstrates that these systems are deeply interconnected. Pollutants such as ozone, nitrogen compounds and other atmospheric contaminants can amplify crop stress and reduce yield performance. Bringing this dimension into the analysis closes the loop, connecting what happens in the atmosphere to what happens in the field.
Visualization in EagleArca
What makes this kind of analysis remarkable is not any single indicator on its own. The true value emerges through the integration of all these dimensions into a unified analytical framework. Vegetation health, biomass, moisture, heat stress, drought, flood risk, terrain deformation, erosion and atmospheric conditions interact continuously, and only together do they describe how the agricultural system truly behaves. This represents the evolution of satellite-based agriculture. Instead of isolated measurements, Earth observation systems increasingly provide holistic environmental intelligence. Satellite platforms are no longer simply imaging systems; they have become analytical infrastructures, capable of describing biological, hydrological, thermal and atmospheric dynamics simultaneously. When these indicators are integrated inside a GIS-based platform such as EagleArca, they become operational tools rather than isolated results.
In EagleArca, each of the indicators we have discussed corresponds to a geospatial layer that can be visualized on the map. Because all layers share the same coordinate system and are georeferenced within the same spatial framework, they can be overlaid and compared directly. This is what turns separate measurements into genuine understanding. An area showing reduced vegetation vigour can be examined alongside the soil moisture layer to see whether the cause is a water deficit. A zone of elevated heat-stress frequency can be read together with the drought index to confirm a developing water-stress condition. A field flagged for low biomass can be overlaid with the erosion or subsidence layers to understand whether terrain factors are involved. In each case, the meaning comes from the relationship between layers.
From an operational perspective, users can spatially compare crop conditions, identify anomalies, monitor their evolution through time, and support agricultural decisions with objective data. Layers can be activated and deactivated, specific areas of interest can be examined in detail, and indicators can be followed over time, distinguishing normal seasonal cycles from genuine anomalies. Ultimately, this demonstrates how satellite systems move beyond simple observation and become decision-support infrastructures, capable of improving resilience, sustainability and precision within modern agricultural ecosystems. By transforming raw observations into actionable knowledge, the Agriculture service helps farmers and managers not only understand the current condition of their land, but also anticipate future risks and plan accordingly.
Satellite Humidity & Irrigation Service
Click here to download the PDF
Satellite Humidity & Irrigation Service
Welcome. In this video, we explore one of the most practical examples of how Earth observation technologies can support precision agriculture. While many satellite services focus on monitoring and analysis, the humidity and irrigation service integrated into EagleArca takes a step further. Its objective is not simply to describe the current condition of agricultural land, but to support daily operational decisions, answering one very practical question: where, when, and how much should we irrigate. This shift, from describing a field to actively advising on it, is what makes the service distinctive. Throughout this video, we will look at why such a service is needed, the philosophy behind it, the information it draws upon, how it reaches a decision, and finally how all of this is delivered and visualized within the EagleArca platform.
Why This Service Exists
Agriculture has always depended on water availability. Traditionally, irrigation decisions have been based on experience, field observations and fixed schedules. However, modern environmental conditions are becoming increasingly complex. Water resources are limited, climatic conditions are more variable, and sustainable farming requires optimizing every available resource. For these reasons, the EagleArca humidity service was designed to transform heterogeneous environmental observations into daily irrigation recommendations. The goal is to replace rigid, generic schedules with guidance that adapts continuously to the real conditions of the land.
The Underlying Philosophy
The philosophy behind this service rests on an important principle: satellite images should not be interpreted as real-time snapshots of the field. Instead, they are treated as observations acquired at a certain point in time, which are then combined with continuously updated meteorological information, irrigation records and short-term weather forecasts. This is what allows the system to produce operational recommendations every day, even when new satellite imagery is temporarily unavailable. Rather than depending on the moment a satellite passes overhead, the service maintains a continuously evolving understanding of the field, updated daily from many sources.
The Three Questions
In practice, the service revolves around three fundamental questions. First, which portions of the cropland require irrigation today? Second, how much water is suggested? And third, can irrigation be postponed because rainfall is expected in the coming days? A key point is that the service does not generate a single recommendation for an entire field. Instead, it produces pixel-based decision maps, allowing different sections of the same field to receive different recommendations according to their local conditions. This spatial detail is what turns a general irrigation strategy into precise, site-specific guidance.
The Data Sources
To answer these questions, the service integrates multiple sources of information, each contributing a different piece of evidence. The first and most important source is weather information. Daily meteorological products provide temperature, precipitation, evapotranspiration, wind speed, humidity, runoff, cloud cover and estimates of soil water content. These variables represent the main driver of crop water demand and form the backbone of the decision-making process.

Sentinel-2 provides optical observations of vegetation. Through indices such as NDVI, NDMI, NDRE, SAVI and other spectral indicators, the system evaluates crop vigour, moisture stress, vegetation activity and the presence of possible surface water. These indicators help identify where crops are healthy, where they are experiencing stress, and where excessive water may already be present.

Sentinel-3 contributes thermal and atmospheric information. Parameters such as land surface temperature, vapour pressure deficit, dew point, soil wetness and cloud fraction provide additional evidence regarding atmospheric stress and field dryness. By combining optical and thermal observations, the service gains a much more complete understanding of crop conditions.

Sentinel-1 can optionally provide background information on soil moisture through radar observations. Since radar penetrates clouds and operates independently of daylight, it adds valuable information regarding field conditions. Terrain information derived from digital elevation models can also be integrated to estimate slope and runoff effects, since steeper terrain tends to lose part of the rainfall through runoff, reducing the amount of water that effectively contributes to soil moisture.
Another important component is the irrigation log. The system records the amount of water already applied to the field and uses this information to continuously update the field water balance. In addition, the service maintains what can be thought of as a simplified virtual water reservoir for every agricultural pixel. This virtual reservoir represents the amount of useful water currently available to the crop. Every day, the reservoir is updated according to a simple water balance equation: the previous water state, plus effective rainfall and irrigation, minus the estimated crop water demand. In this way, each pixel carries its own continuously updated memory of how much water the crop actually has at its disposal.
The Role of Forecasts
One of the most interesting aspects of the system is its use of weather forecasts. Instead of considering only today's conditions, the service analyses expected precipitation and evapotranspiration over the next 24, 48 and 72 hours. If the forecast indicates that upcoming rainfall will provide sufficient water to satisfy crop demand, irrigation can be postponed. In this way, the service avoids unnecessary irrigation, reducing water consumption and increasing sustainability. Looking ahead, rather than only at the present, is what allows the system to prevent waste before it happens.
The Decision Process and Operational Robustness
The final decision process combines all the available evidence: previous soil conditions, Sentinel-2 vegetation stress indicators, Sentinel-3 atmospheric information, optional Sentinel-1 soil moisture, forecast rainfall, evapotranspiration and terrain characteristics. An important feature of this design is its robustness. Even if some optional layers are missing, the system continues to operate, assigning a lower confidence score instead of interrupting the process. This design philosophy ensures that the service remains operational under real-world conditions, where data is not always complete.
The Outputs
The output generated by the service is far richer than a simple yes-or-no irrigation recommendation. Several GeoTIFF layers are produced. These include estimated water demand, suggested irrigation amount in millimetres, maps indicating where irrigation can be postponed, confidence scores and final decision classes. The decision map classifies every agricultural pixel into one of four categories: no data, no irrigation required, postpone irrigation, or irrigation recommended. Additional evaluation layers provide a simplified interpretation of crop water conditions using a traffic-light approach.
Green areas indicate adequate moisture, yellow regions suggest moderate concern, red areas correspond to water deficit conditions, and a separate category identifies zones where rainfall is expected to satisfy future water needs. Behind these classes lies a water deficit index ranging from zero to one hundred, which quantifies the severity of crop water stress. The service also produces forecast products describing expected rainfall and evapotranspiration over different time horizons.
This allows users to understand not only the current situation, but also how water availability is expected to evolve over the coming days. The ratio between forecast rainfall and crop demand provides an estimate of how much of the crop water requirement will be naturally satisfied by precipitation. Besides raster products, EagleArca generates human-readable summaries and smart alerts. These alerts transform complex geospatial statistics into operational messages. For example, the system may indicate that a large portion of the field requires irrigation, that irrigation can safely be postponed because rainfall is expected, or that the confidence of the decision is reduced because some information layers were unavailable.
Visualization in EagleArca
Inside EagleArca, all these products become georeferenced GIS layers that can be visualized in both 2D and 3D environments. Users can inspect irrigation recommendations spatially, compare them with vegetation health, soil moisture, temperature and weather layers, and observe how conditions evolve through time. Instead of treating agriculture as a collection of isolated measurements, EagleArca transforms satellite observations, weather models, irrigation logs and forecasts into a unified decision-support system.
Ultimately, this humidity and irrigation service represents an example of how Earth observation technologies are evolving from passive monitoring systems into active decision-support infrastructures. By combining satellite imagery, weather forecasts, historical information and field management data, the system helps farmers optimize water use, improve crop resilience and support sustainable agricultural practices. Rather than simply observing the field, the service continuously interprets its behaviour, predicts its future needs, and provides operational recommendations that can contribute to more efficient and climate-resilient agriculture.