[Click here to donwload the PDF](https://wiki.eaglearca.com/attachments/15)
**Satellite Urbanization Service** Welcome. In this video, we explore a practical example of how satellite-derived analytics and geospatial intelligence can be transformed into a concrete decision-support tool for urban planning and territorial resilience. The objective is to understand how Earth observation can move beyond simple visualization and become a multidimensional framework for understanding how a territory actually behaves. To do this, we will not treat the city as a static picture seen from above, but as a physical system that can be measured. A satellite image of a city may show buildings, roads and green spaces, but on its own it tells us little about how that environment is changing or where it is vulnerable. The Urbanization service is designed to go much further. We will follow a comprehensive urban risk and resilience analysis generated over a complete Area of Interest, often abbreviated as AOI. Within this area, thousands of individual spatial cells are processed, each one carrying environmental, urban, climatic and geotechnical information. The result is not a single map, but a layered portrait of the city as a living system. In the following sections, we will look at what this service examines, which satellite data it relies on, what kind of results it produces, and finally how all of this information is visualized and explored within the EagleArca platform. And throughout, one idea will return constantly: none of these indicators stands alone. Their real value emerges only when they are read together. **What the Service Examines** The Urbanization service is built around a simple but powerful idea: a city is a physical system, and like any physical system, it can be described through measurable variables. Rather than focusing on a single aspect, the service examines the urban environment across several complementary dimensions, because urban risk and resilience never depend on one factor alone. The first dimension is what physically exists inside the territory: how much of it is vegetation, soil, built environment or water. This is the necessary starting point, because urban risk is not interpreted in the same way in a forested landscape, an agricultural region or a dense city. The second dimension is the physical extent of the city and how it changes over time. Urban growth is not uniform. In some places development fills the gaps inside existing neighbourhoods; in others it expands along the edges of the city, or appears as scattered, isolated patches far from the existing urban fabric. Each of these patterns has very different consequences for infrastructure and for the surrounding landscape. The third dimension concerns the surfaces of the city and their environmental behaviour. Artificial materials such as asphalt and concrete do not behave like soil or vegetation. They prevent water from infiltrating into the ground, they absorb and store heat, and they alter the local climate. The service therefore examines how sealed the urban surface is, how much green space remains, and how these factors influence both water management and thermal conditions. The fourth dimension is thermal behaviour: the tendency of cities to become warmer than the rural areas around them, with direct consequences for energy demand, public health and comfort. The fifth dimension is environmental and atmospheric pressure: the quality of the air over the urban area, and the broader climatic stress to which the city is subjected, combining the effects of heat and precipitation. And the final dimension is the stability of the ground itself and the city's exposure to water-related risk: whether the terrain is slowly sinking or shifting beneath buildings and infrastructure, and where water is likely to accumulate during intense rainfall. Taken together, these dimensions describe not just where the city is, but how it lives and where it is fragile. **What Data the Service Uses** To examine these many dimensions, the Urbanization service does not rely on a single satellite. It integrates observations from several missions of the European Union's Copernicus programme, each contributing a different and complementary physical measurement. This is fundamental, because no single sensor can capture the full complexity of an urban environment. Optical imagery, radar backscatter, thermal emission and atmospheric chemistry all describe different physical aspects of the same territory, and the real power lies in fusing them into a single coherent picture. 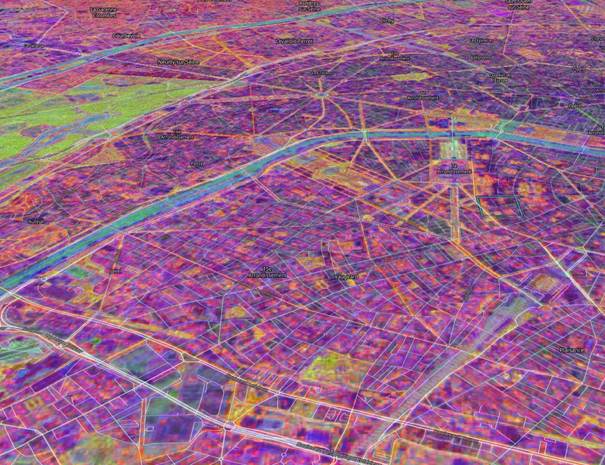 The first essential source is **Sentinel-2**, the optical multispectral mission. Sentinel-2 does not simply produce images; it measures how the Earth's surface reflects solar radiation across thirteen spectral bands, from the visible to the short-wave infrared. Because different materials, such as vegetation, soil, water and artificial surfaces, reflect radiation in characteristic ways, this multispectral information allows each part of the territory to be classified into land-cover categories. This classification is the foundation of the entire service: it is what allows us to distinguish buildings from vegetation, to measure how much of the area is artificial, and to track how that proportion changes over time. Sentinel-2 also provides the vegetation information used to assess urban green coverage, and its detailed spatial resolution makes it possible to follow urban patterns at the scale of individual neighbourhoods. 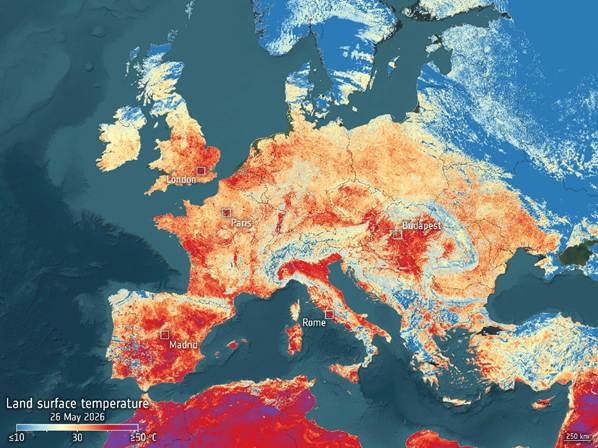 The second source is **Sentinel-3**, and in particular its thermal observation capability. Unlike optical sensors that measure reflected sunlight, Sentinel-3 measures the radiation that surfaces themselves emit, which makes it possible to estimate the physical temperature of the ground, known as Land Surface Temperature. This is exactly what is needed to study the urban heat island effect, mapping where heat accumulates and identifying the most thermally vulnerable zones. 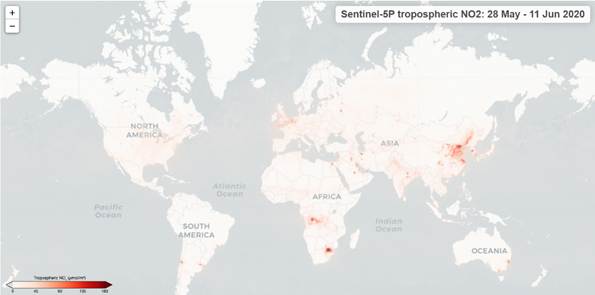 The third source is **Sentinel-5P**, the atmospheric monitoring mission. Its TROPOMI instrument, the Tropospheric Monitoring Instrument, measures the concentration of pollutants and other atmospheric components across the globe. In the urban context, this provides the basis for assessing air quality, since cities concentrate the traffic, industry and energy consumption that drive pollution. 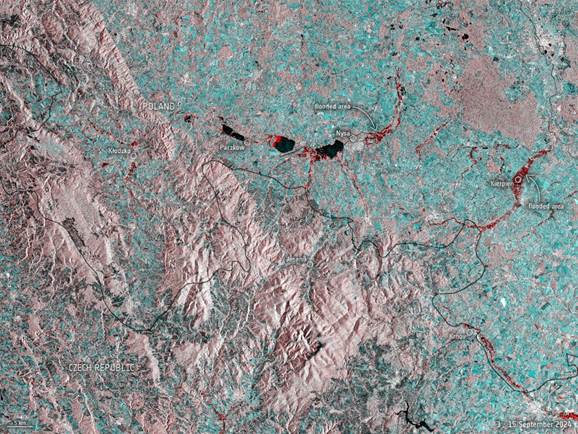 The fourth source is **Sentinel-1**, the radar mission. Because radar is an active sensor that emits its own microwave signal, Sentinel-1 can observe the surface regardless of cloud cover or daylight. Its most powerful contribution to the urban context comes from interferometry, a technique that compares radar acquisitions over time to detect extremely small movements of the ground, on the order of millimetres. This is what allows the service to measure subsidence, the slow sinking or shifting of the ground, and to assess the stability of the terrain beneath buildings and infrastructure. 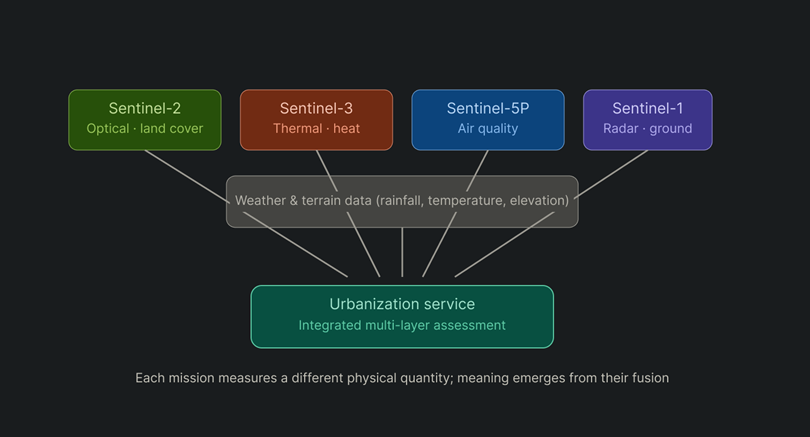 Finally, the service integrates meteorological and climatic information, such as rainfall and temperature, together with terrain data such as elevation models. This information is essential for the climate stress and flood-related components, where the shape of the land and the intensity of precipitation combine with the urban surface to determine risk. The strength of the service lies precisely in this integration. Each mission measures a different physical quantity, and only by combining them does a complete picture of the urban environment emerge. **Applied Results** Once these data sources are combined and processed, the service produces a structured set of indicators that describe the state of the urban environment and its exposure to risk. Let us walk through them in a logical order, and at each step look not only at what is measured, but at why it matters. **Land Classification** 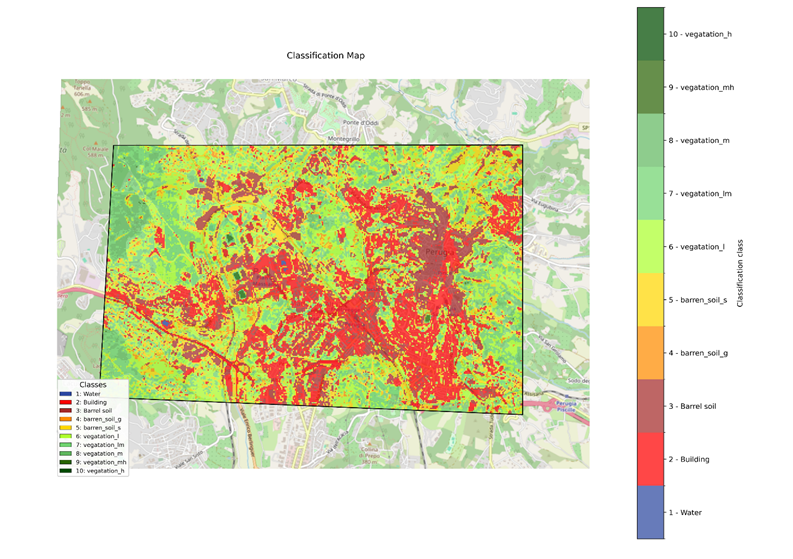 The analysis begins with a fundamental layer: land classification. Before evaluating risk or resilience, it is necessary to understand what physically exists inside the territory. Through satellite-based classification algorithms, every cell inside the area is assigned to a macro class such as vegetation, soil, building or water. In this specific analysis, vegetation represents the dominant component of the territory, followed by soil and then buildings, while water occupies only a minimal fraction of the area. This first classification may appear simple, but it establishes the context for every subsequent analysis. Land cover becomes the first explanatory variable for everything that follows: vegetation affects temperature regulation, infiltration capacity and ecological resilience, while built surfaces influence how runoff is generated and how heat accumulates. **Urban Footprint and Urban Growth** **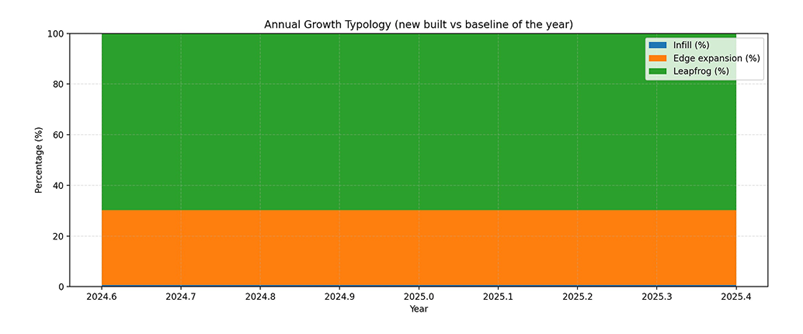** From this foundation, the analysis moves to the urban footprint. It estimates the amount of built-up area and artificial coverage inside the AOI. In this case, approximately 4.8 square kilometres are classified as built-up, with artificial surfaces covering around nineteen percent of the territory. But static urban extent alone does not tell the full story, because cities evolve dynamically. The analysis therefore investigates urban growth by comparing built-up patterns over time. Interestingly, in this area it identifies a negative urban expansion value. This does not necessarily mean the city is shrinking; it may indicate either a real contraction or differences in classification between the time intervals being compared. At the same time, hotspot detection identifies specific localized areas where a genuine change from non-built-up to built-up conditions has occurred. 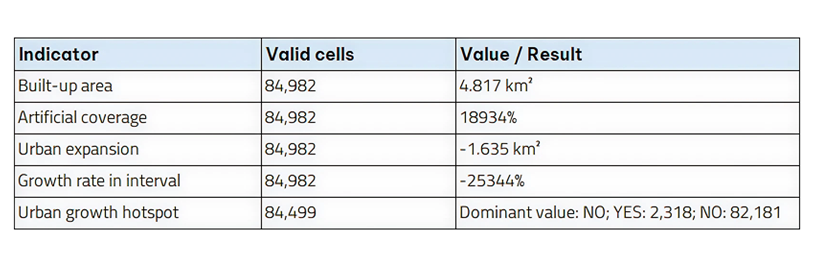 This introduces an important urban planning concept: growth typology. Not all urban growth occurs in the same way. The analysis distinguishes between infill development, which fills the gaps inside existing urban areas; edge expansion, which extends growth along existing boundaries; and leapfrog development, which appears as isolated patches disconnected from the existing urban fabric. In this area, leapfrog growth dominates. From an urban planning perspective, leapfrog growth is often considered problematic, because development in isolated patches frequently increases infrastructure costs, creates transportation inefficiencies and leads to environmental fragmentation. By contrast, compact growth and infill development are usually considered far more sustainable. **Impervious Surfaces and Green Coverage** **** The next indicator is one of the most operationally relevant: impervious surface estimation. In this analysis, approximately fifty percent of the territory exhibits the characteristics associated with paved or low-infiltration surfaces. Impervious surfaces fundamentally alter the hydrological behaviour of the landscape: rainwater that would naturally infiltrate into the soil instead becomes surface runoff, increasing pressure on drainage systems and elevating flood susceptibility. Consistently with this, the analysis identifies thousands of cells associated with runoff risk. 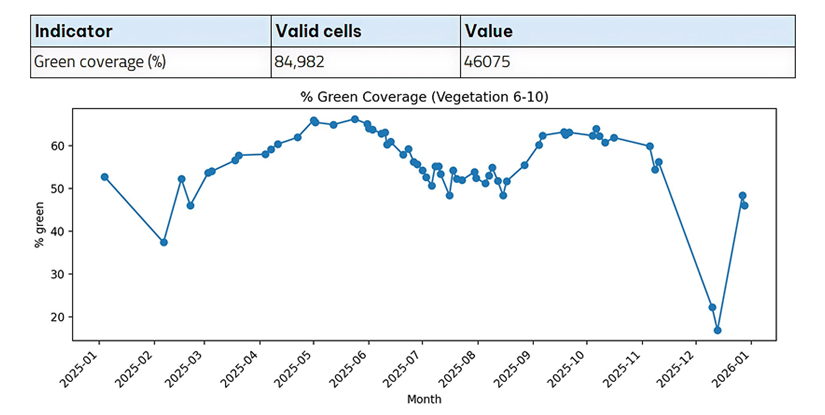 The analysis then evaluates ecological resilience through green coverage. Vegetation occupies approximately forty-six percent of the area. But urban vegetation is much more than aesthetics. Green areas regulate temperature through evapotranspiration, improve air quality, reduce runoff, support biodiversity and enhance human well-being. In resilient city design, vegetation functions as genuine environmental infrastructure. **Urban Heat Island** **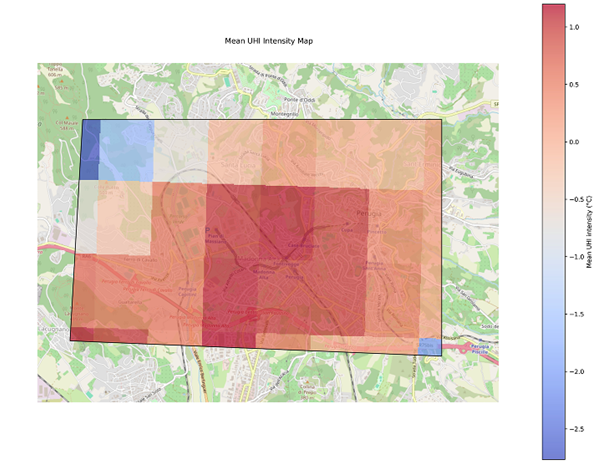** **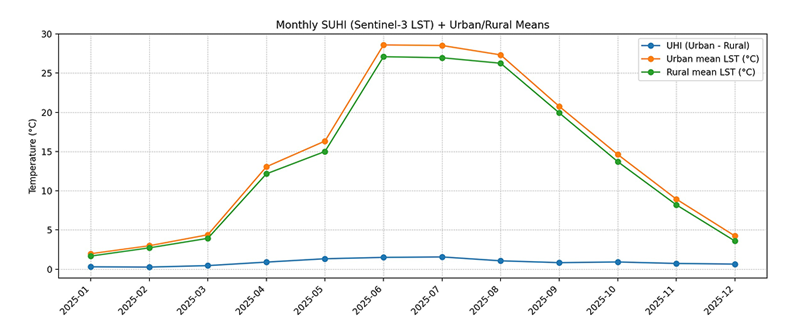** This relationship becomes particularly evident with the Urban Heat Island. Heat islands are areas where urbanized surfaces become thermally warmer than the surrounding environment. Here the mean urban heat island intensity is relatively moderate, although the vulnerability zones vary substantially across the area. Heat islands are one of the clearest examples of how urban morphology influences local climate: materials such as asphalt and concrete absorb solar radiation during the day and release it slowly at night, while reduced vegetation and limited airflow amplify the phenomenon. Excessive urban heat affects energy demand, public health and environmental comfort, and it concentrates precisely where vegetation is scarce and impervious coverage is high. **Satellite-Based Air Quality** **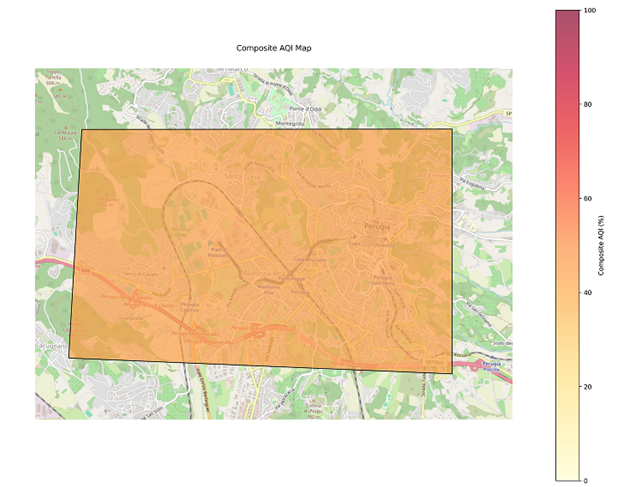** The analysis then integrates atmospheric observations through a satellite-based air quality index. Composite air quality values and pollution distributions are estimated spatially across the entire AOI. This introduces an important principle: urban environments should not be evaluated only through physical infrastructure. Environmental quality must also be considered, because air quality directly influences public health, urban attractiveness and long-term sustainability. Mapping pollution spatially, rather than relying on a single average, is what reveals local pressures where they actually occur. **Climate Stress** **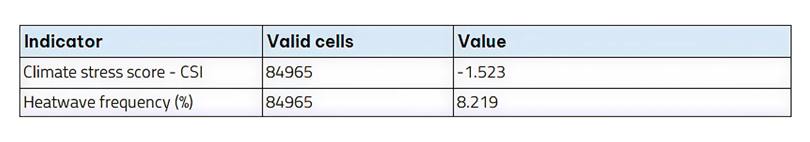** The next indicator moves towards climate adaptation through the Climate Stress Index. This metric combines deviations in heat and precipitation behaviour to identify stressful conditions relative to a baseline, and it also estimates the frequency of heatwave conditions. Climate stress indicators are increasingly important because urban systems are now exposed to growing climatic uncertainty, and infrastructure designed under historical climatic assumptions may not perform adequately under future conditions. **Subsidence and Ground Stability** **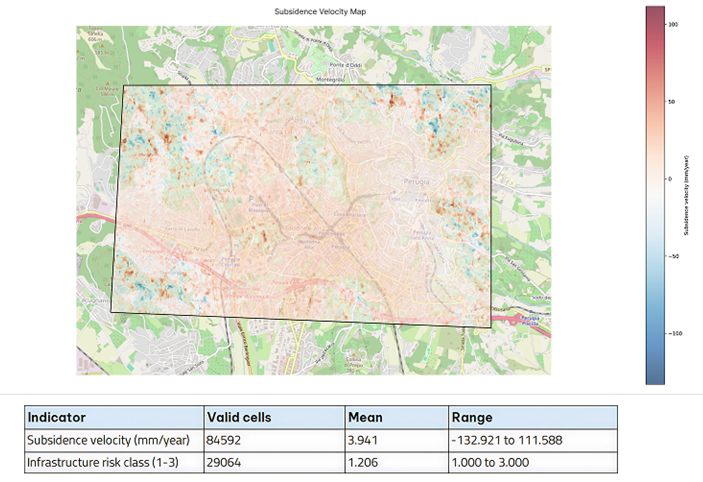** The analysis then enters the geotechnical domain through subsidence analysis. Ground movement, derived from satellite interferometric observations, reveals the vertical displacement behaviour of the terrain and the associated infrastructure risk classes. Subsidence is one of the most powerful examples of what satellite monitoring can achieve: deformation at the scale of millimetres can be observed consistently over very large territories. This is extremely valuable for transportation networks, historical city centres, pipelines and urban infrastructure management, where even slow ground movement can have serious consequences over time. 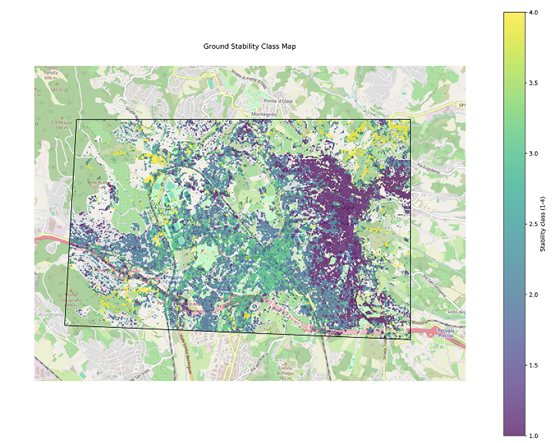 Ground stability analysis complements this by classifying stability conditions across the area and identifying alert zones, where deformation anomalies deserve additional investigation. In this analysis, thousands of alert cells are identified. Together, subsidence and ground stability describe not only how much the ground is moving, but where that movement could threaten the built environment. **Flood Susceptibility** **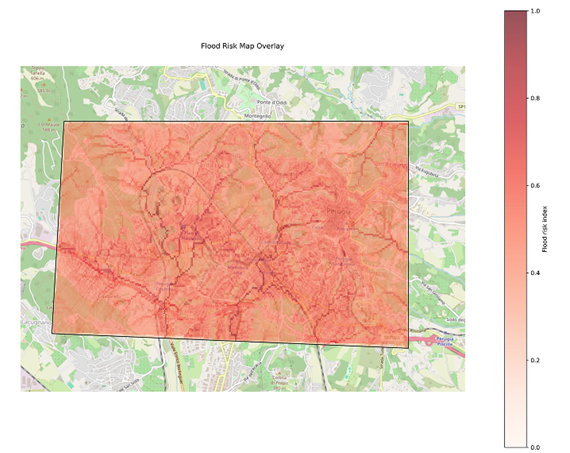** Finally, the analysis concludes with one of the most integrated assessments of all: flood susceptibility. Flood risk is not treated as a single parameter, but as the result of multiple interacting variables, including terrain morphology, drainage behaviour, surface imperviousness and rainfall. 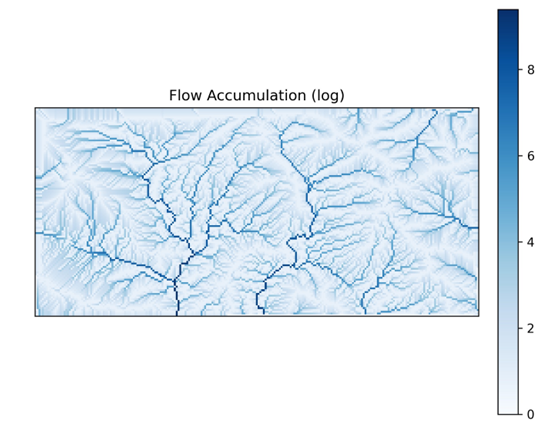 To support this, several classical hydrological descriptors are introduced. A Digital Elevation Model describes the shape of the terrain and controls the direction in which surface water flows and where it accumulates. Flow accumulation maps represent how many upstream cells drain into each location, highlighting where runoff naturally converges. Slope calculations describe terrain steepness, since steeper slopes promote rapid drainage while flatter areas allow water to accumulate. The Topographic Wetness Index estimates where water is most likely to remain in the landscape, typically in valley bottoms and poorly drained terrain. And the extracted drainage network approximates the natural channels through which runoff travels. 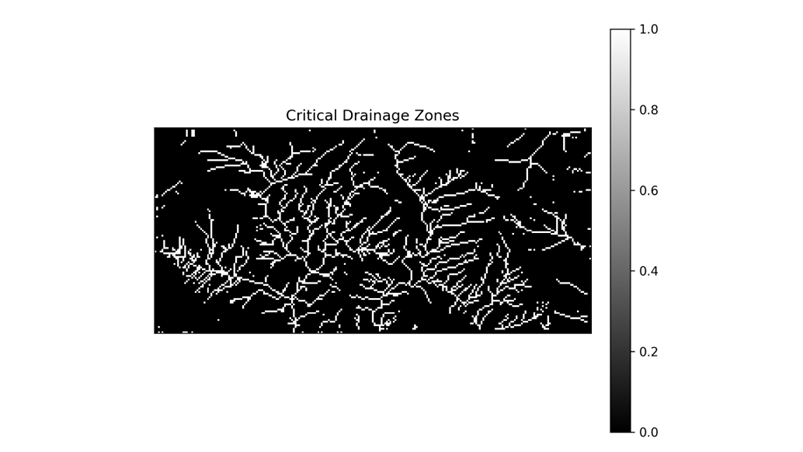 By combining these descriptors with imperviousness and rainfall, the analysis identifies critical drainage zones, where multiple risk conditions converge simultaneously. These become priority areas for monitoring and mitigation planning, because they are where urban drainage systems are most likely to come under stress during extreme rainfall events. **Visualization in EagleArca** What makes this kind of analysis particularly powerful is not any individual metric on its own. The true value emerges through the integration of heterogeneous geospatial information. Classification, urban growth, heat, air quality, climate stress, subsidence, terrain morphology and flood susceptibility all contribute to a single, multidimensional understanding of how the territory behaves. This reflects the evolution of modern Earth observation systems. Satellite platforms are no longer simply imaging systems. They have become analytical infrastructures, capable of describing environmental, urban and climatic dynamics simultaneously. When these indicators are integrated inside a GIS-based platform such as EagleArca, they become operational tools rather than isolated results. In EagleArca, each of the indicators we have discussed corresponds to a geospatial layer that can be visualized on the map. Because all layers share the same coordinate system and are georeferenced within the same spatial framework, they can be overlaid and compared directly. This is what turns separate measurements into genuine understanding. A zone of elevated surface temperature can be examined alongside the classification layer to confirm that it corresponds to dense building with little vegetation. An area flagged for ground instability can be overlaid with the built-up footprint to identify which infrastructure is exposed. A critical drainage zone can be read together with the impervious surface layer and the terrain model to understand exactly why water concentrates there. In each case, the meaning comes from the relationship between layers. From an operational perspective, this supports decision-making for urban planners, infrastructure managers, environmental agencies and resilience strategies. Users can activate and deactivate layers, focus on specific areas of interest, and explore how indicators evolve over time, distinguishing steady trends from sudden changes. Ultimately, this demonstrates how satellite-derived intelligence can transform raw observations into actionable territorial knowledge, enabling cities and regions not only to understand their current conditions, but also to anticipate future vulnerabilities and to support smarter, more resilient planning strategies.