Using panels
![]() English version
English version
This section provides guidance on the use and functionality of the main project management and analysis panels.
Layers Panel
The Layers Panel (icon with three overlapping panels) allows you to manage the visibility, locking, labels and snap of the object classes and resources in the project.
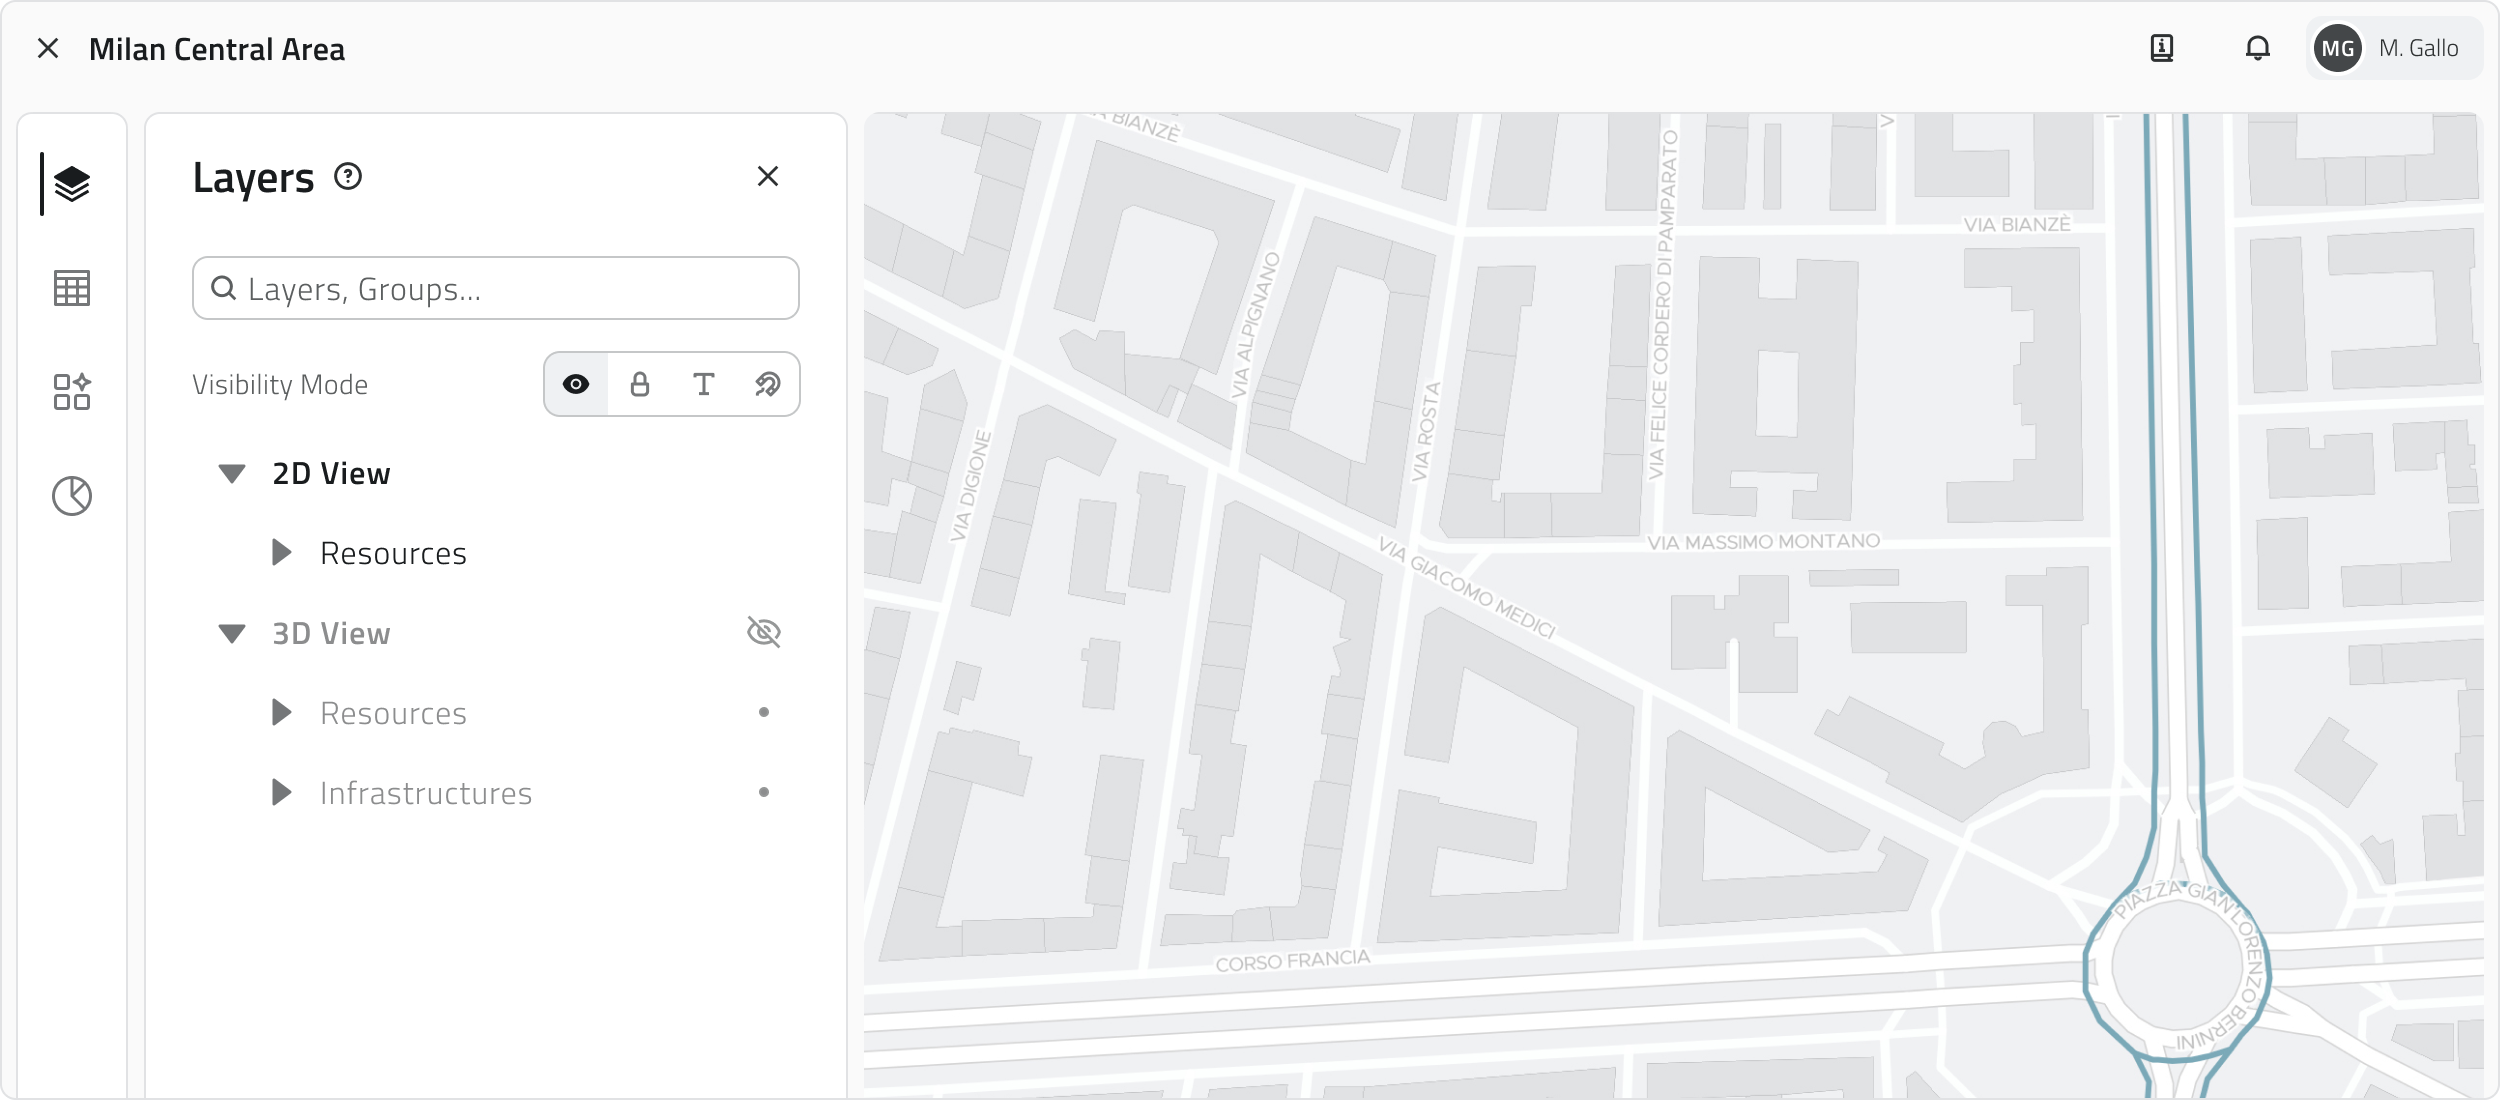
Interaction modes
To switch between modes, click the icons in the selector next to the name of the mode you are in. The available modes are:
| Mode | Function | Interaction | Note |
| Visibility | Show or hide instances in the 2D and 3D views. | Click the eye icon next to the name of the Object Class. | Visibility is separate between 2D and 3D. |
| Lock | Prevent interactions on instances in the 2D and 3D views, instances remain visible. | Click the lock icon next to the name of the Object Class. | All layers are unlocked by default. |
| Label | Show a label above each instance in the 2D and 3D views. | Click the text icon next to the name of the Object Class. | Disabled by default. |
| Snap | Disable automatic snap on instances in the 2D and 3D views. | Click the magnet icon next to the name of the Object Class. | Snap is active by default on all classes. |
💡 Tips:
- Enable locking on layers that should not be modified to avoid unwanted selections or interactions.
- Enable labels only for the classes you want to identify quickly, to avoid overloading the map.
- If snap interferes with drawing geometries or taking measurements, disable it on classes with many objects.
Inventory Panel
The Inventory Panel (table-shaped icon) is the dedicated tool for managing and browsing the object classes in the project.
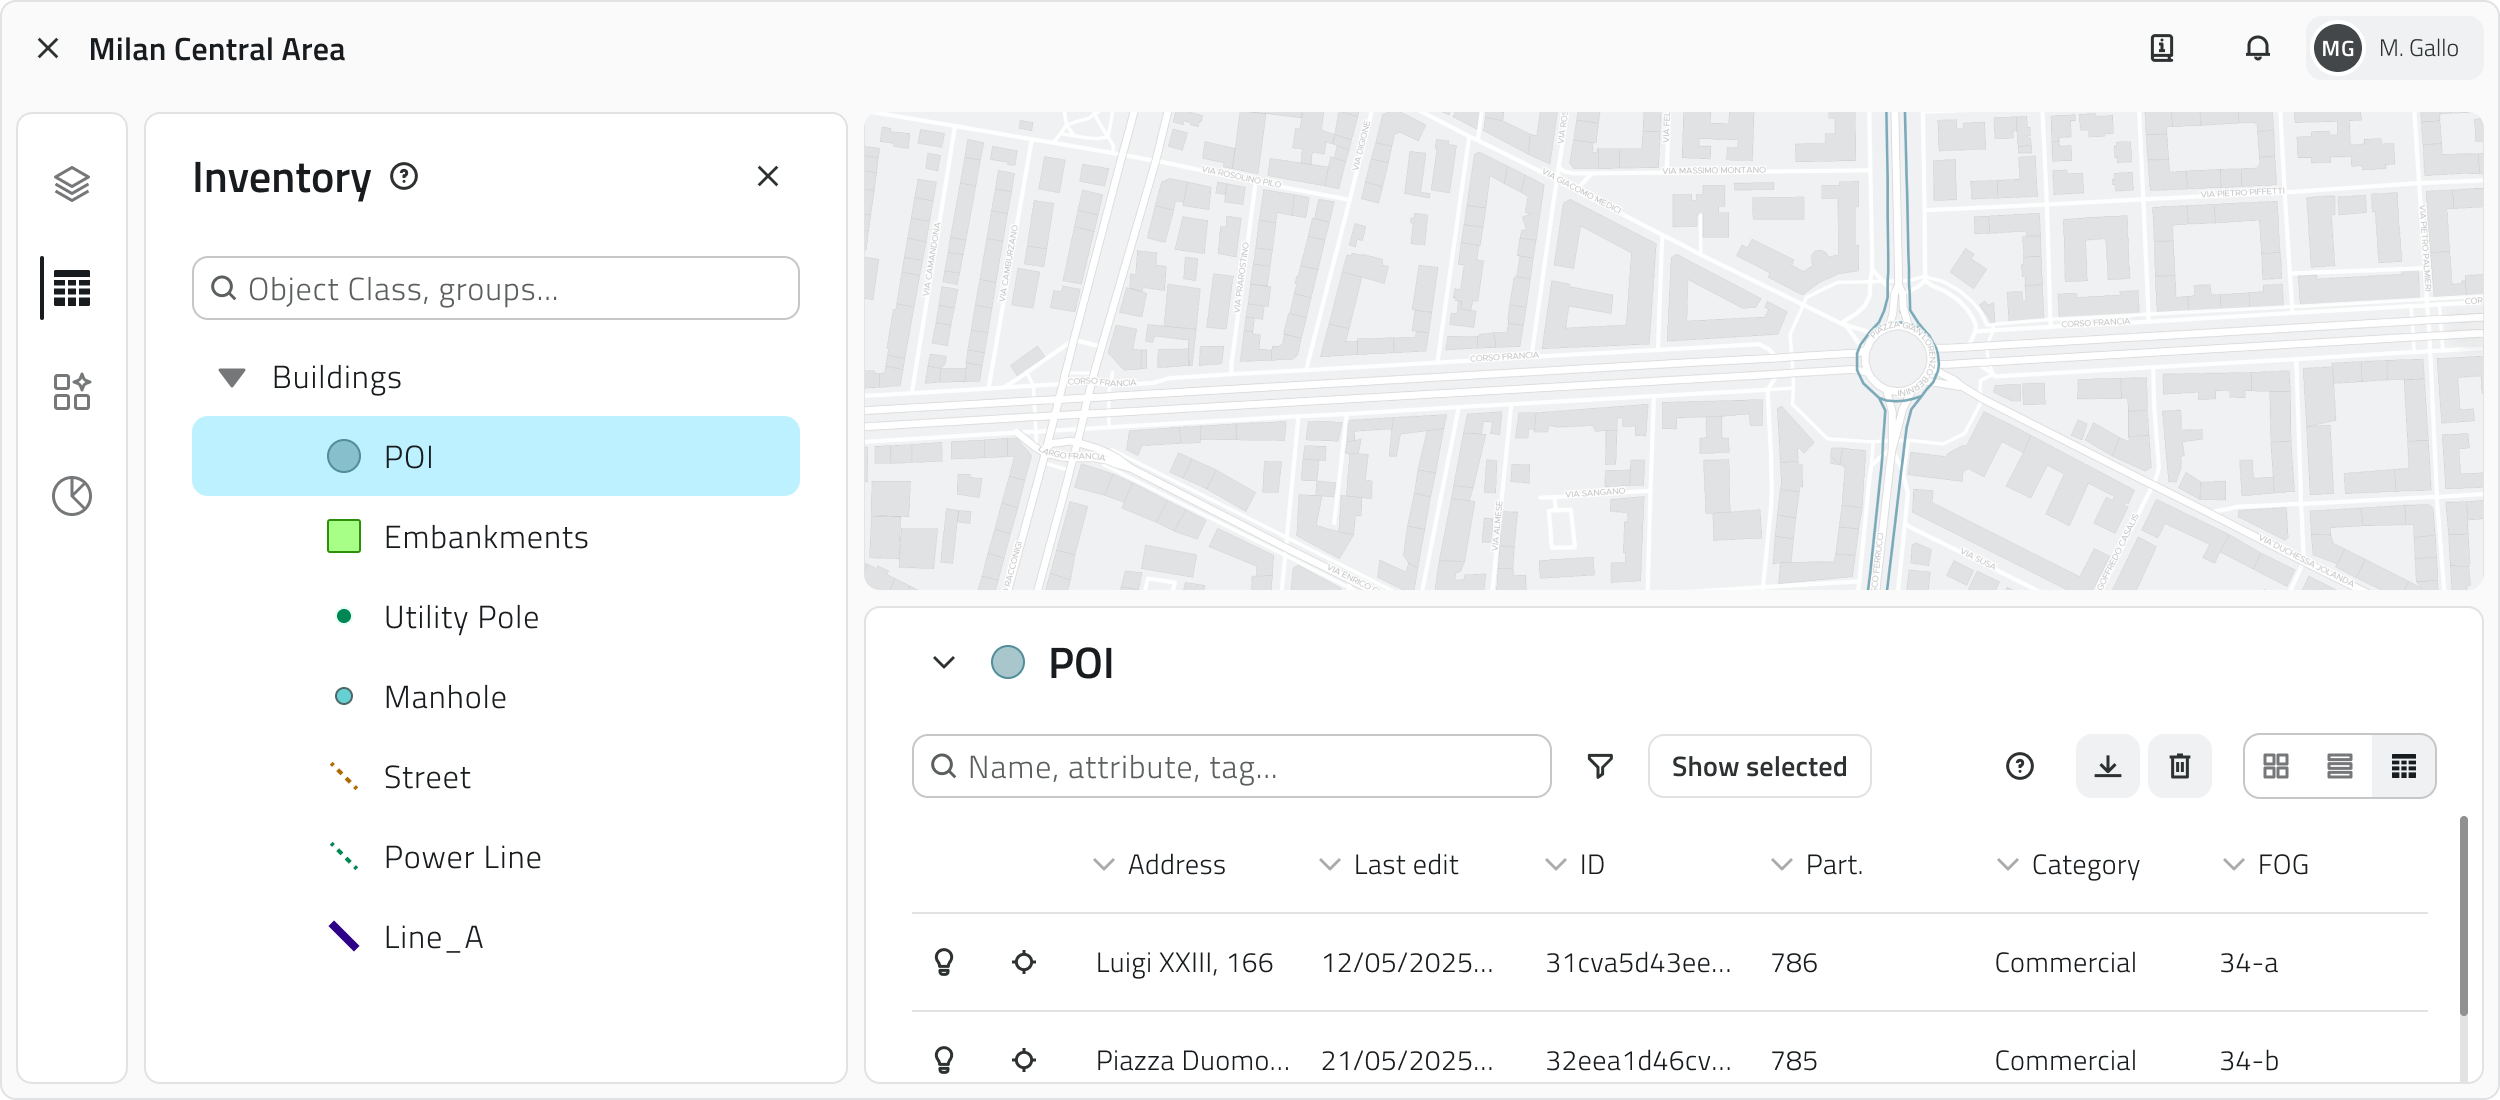
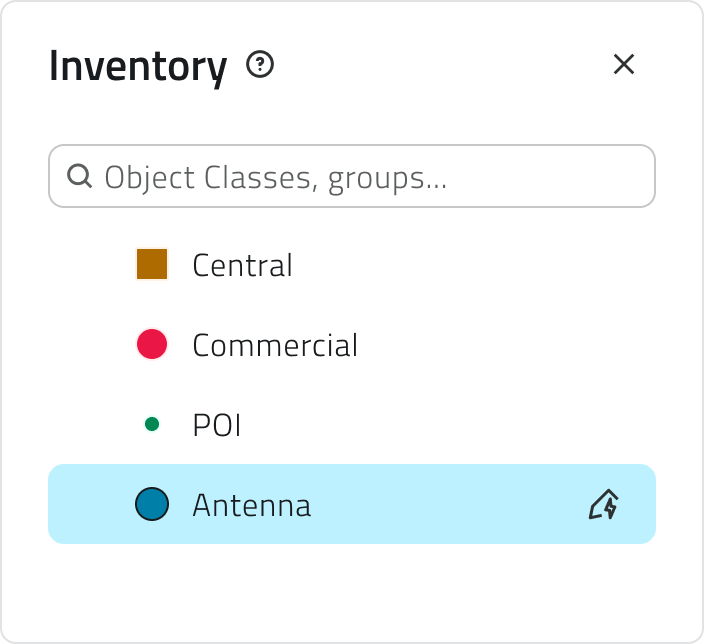
Clicking on the name of an object class in the list opens the corresponding Inventory view. Next to each class name, the style applied to the objects on the map is shown, useful for identifying them more easily. For Form type classes, which have no geometry on the map, the Form icon appears instead: these classes can only be accessed and browsed from the Inventory panel. For classes that have the automatic object creation function enabled, the corresponding icon is shown at the end of the row.
To quickly filter object classes without scrolling through the full list, use the search bar at the top of the panel.
Dashboard Panel
Available only with sensors configured in advance.
The Dashboard Panel (pie chart icon) allows you to view the charts associated with selected objects and is the dedicated tool for data analysis.
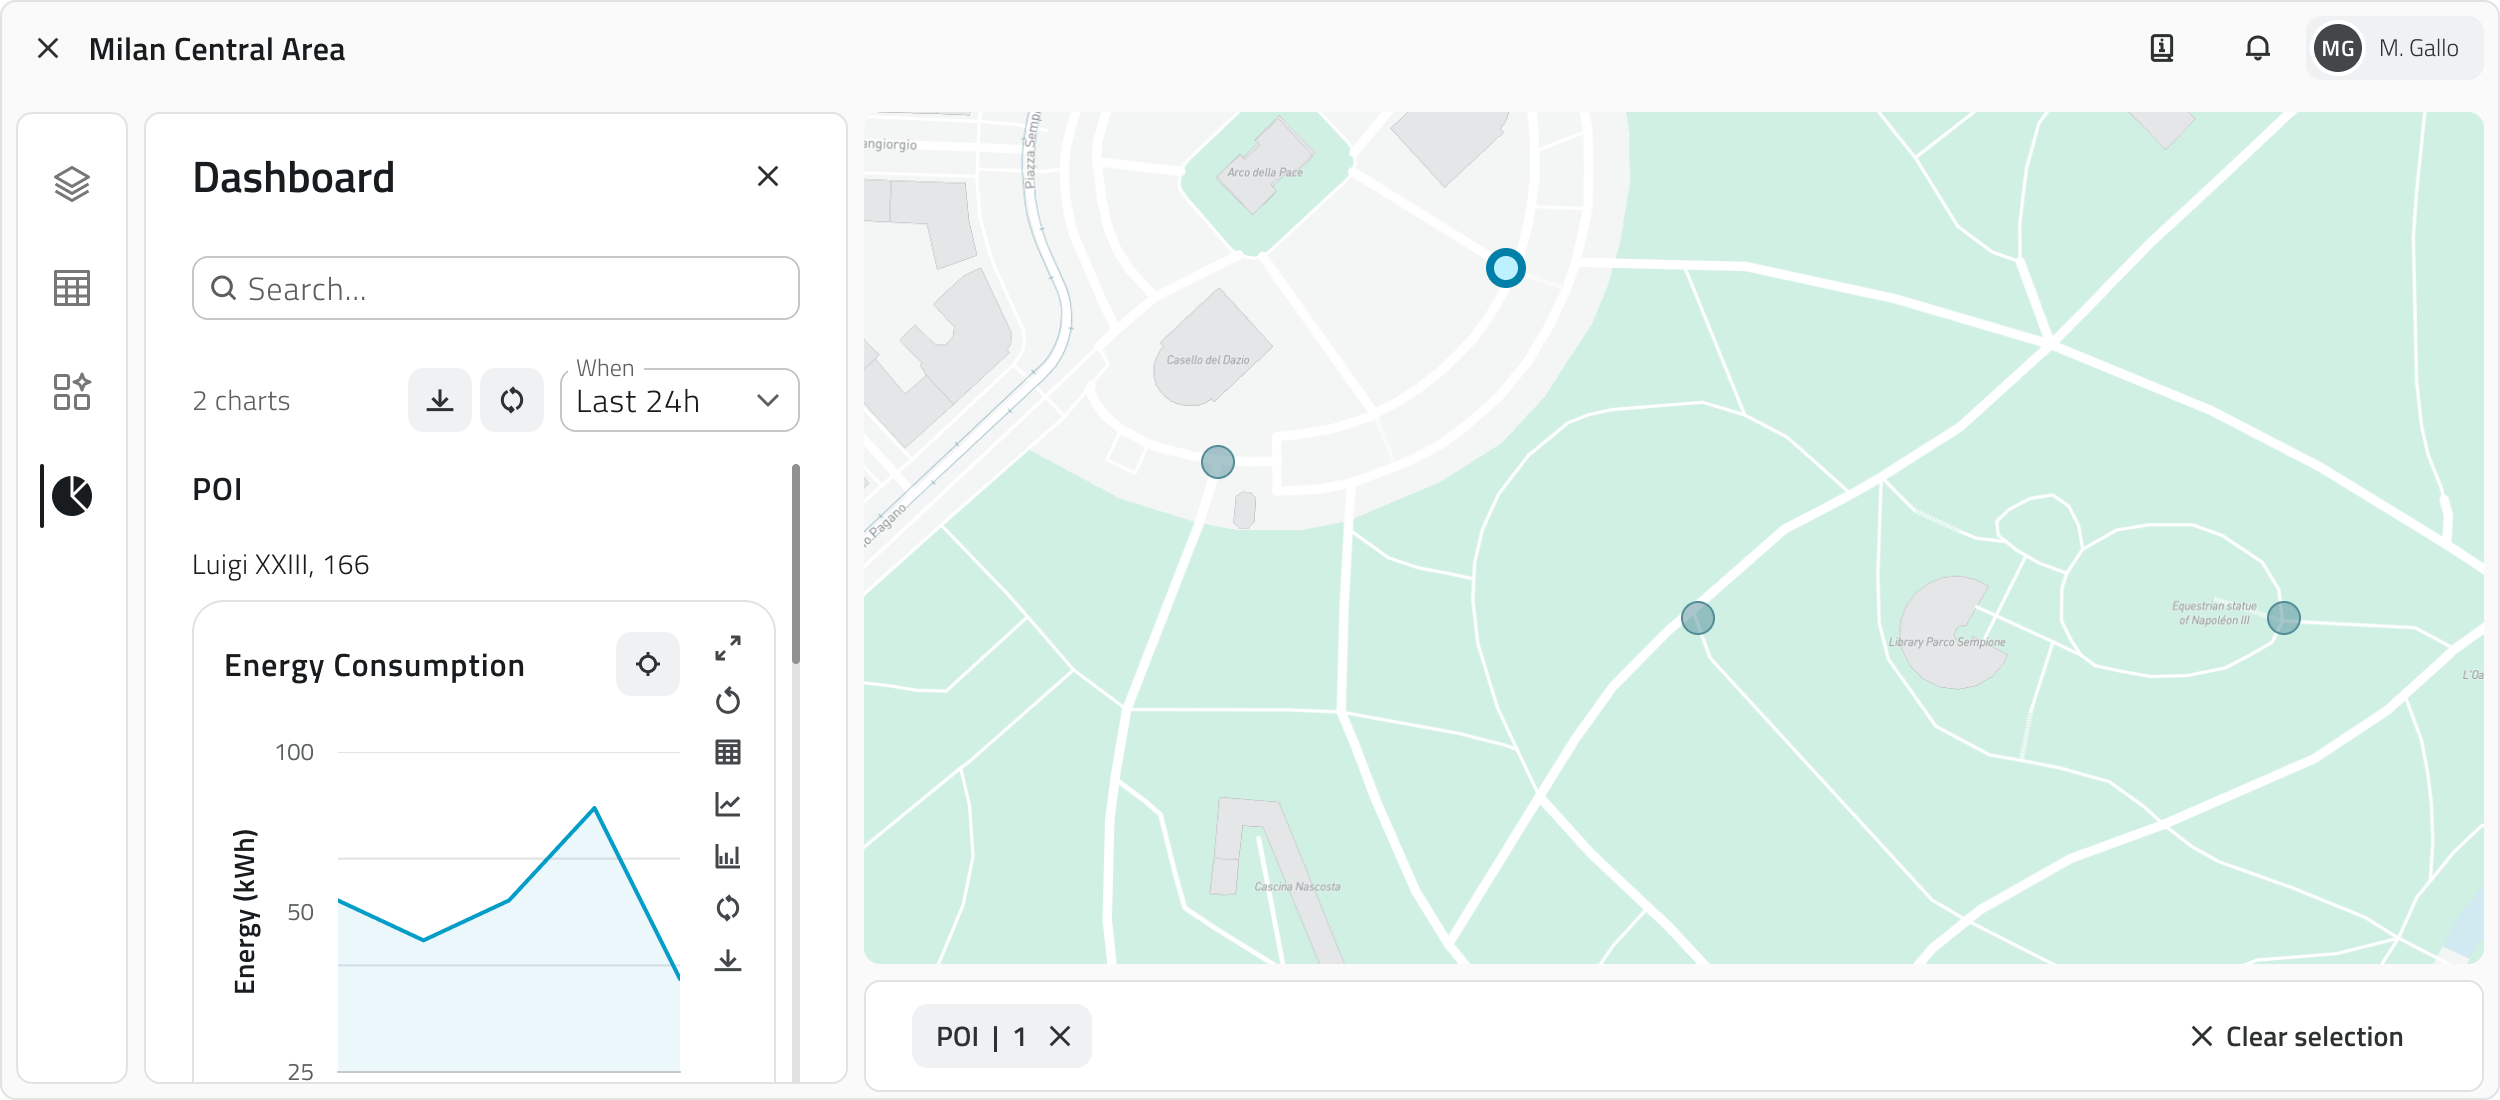
When no objects are selected, the panel is empty. It populates when one or more objects are selected from the 2D, 3D or Inventory view, provided they have chart-type attributes.
The charts are displayed in a column and grouped by object: above each group the main attribute of the object appears, followed by the charts associated with it. The process repeats for each selected object.
💡 Tip: By selecting multiple objects at once you can compare the charts of various objects.
Report Panel
The Report Panel (document-shaped icon) is the dedicated tool for browsing the reports configured for the project.
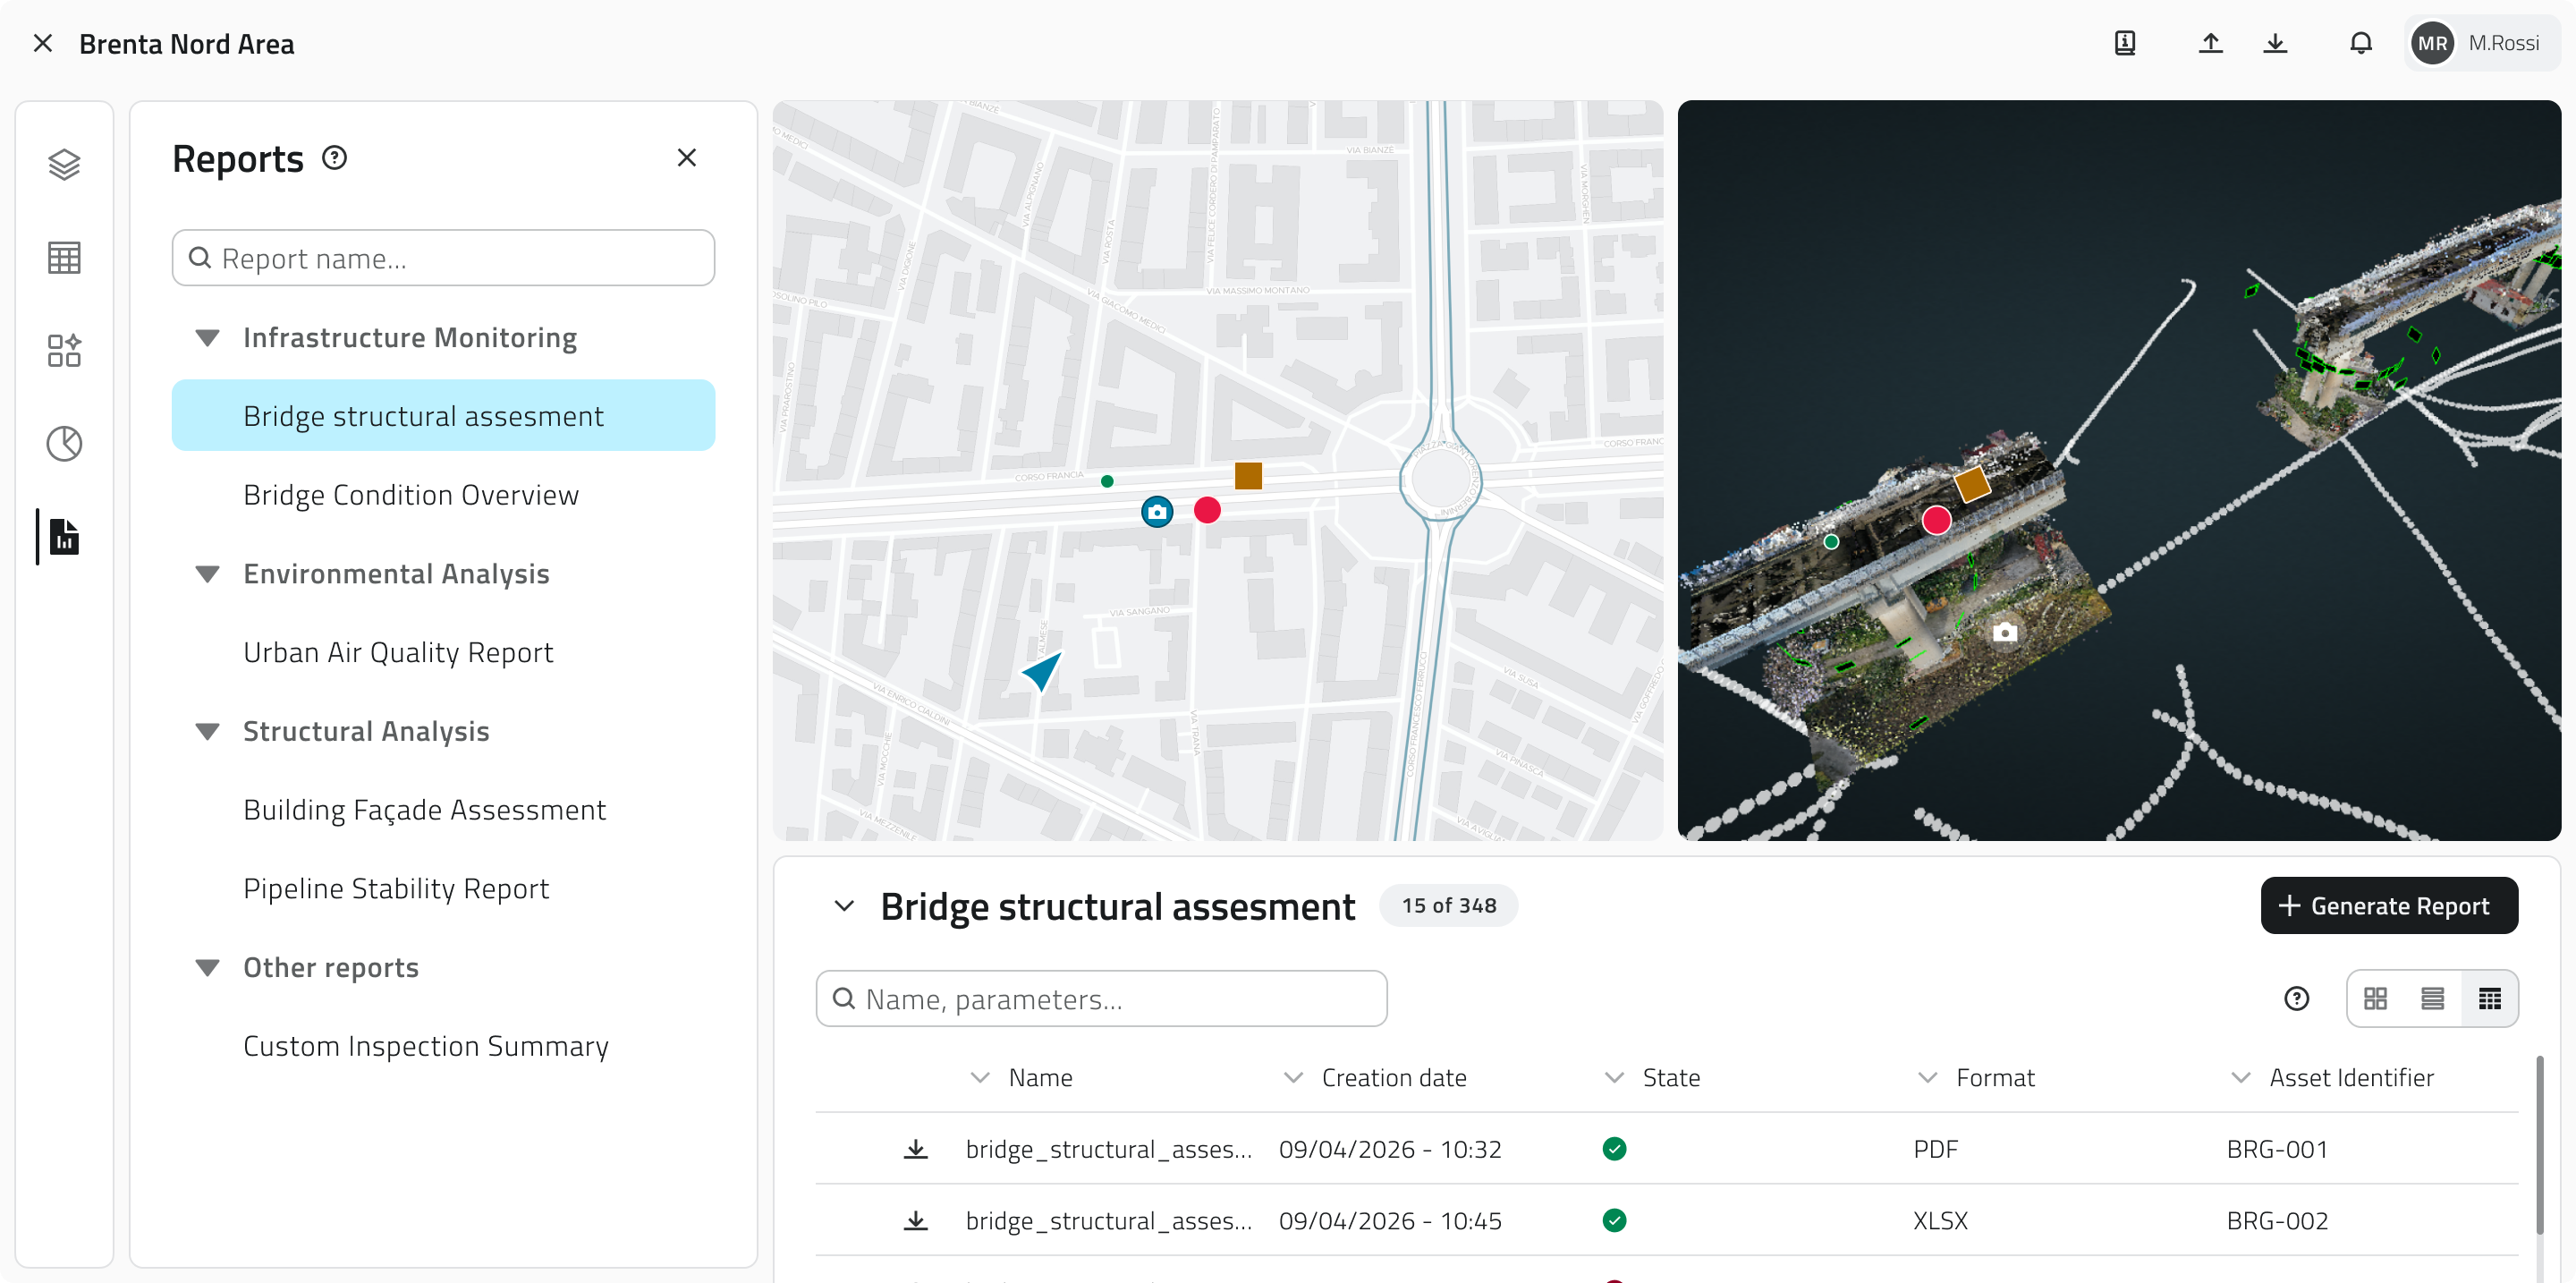
Clicking on the name of a report in the list opens the corresponding Report view. The available reports are grouped by category, making it easier to find the one of interest.
To quickly filter reports without scrolling through the full list, use the search bar at the top of the panel.
Links
![]() Italian version
Italian version
Questa sezione fornisce indicazioni sull'utilizzo e le funzionalità dei principali pannelli di gestione e analisi del progetto.
Pannello Layers
Il Pannello Layers (icona con tre pannelli sovrapposti) permette di gestire la visibilità, il blocco, le etichette e lo snap delle classi oggetto e delle risorse presenti nel progetto.
Modalità di interazione
Per passare da una modalità all'altra clicca sulle icone nel selettore, accanto al nome della modalità in cui ti trovi. Le modalità disponibili sono:
| Modalità | Funzione | Interazione | Nota |
| Visualizzazione | Mostrare o nascondere istanze nelle viste 2D e 3D. | Clicca sull'icona dell'occhio accanto al nome della Classe Oggetto. | La visibilità è separata tra 2D e 3D. |
| Blocco | Impedire interazioni sulle istanze nelle viste 2D e 3D, le istanze restano visibili. | Clicca sull'icona del lucchetto accanto al nome della Classe Oggetto. | Tutti i livelli sono sbloccati di default. |
| Etichetta | Mostrare un’etichetta sopra ogni istanza nelle viste 2D e 3D. | Clicca sull'icona del testo accanto al nome della Classe Oggetto. | Disattivate di default. |
| Snap | Disattivare lo snap automatico sulle istanze nelle viste 2D e 3D. | Clicca sull'icona della calamita accanto al nome della Classe Oggetto. | Lo snap è attivo di default su tutte le classi. |
💡 Suggerimenti:
- Attiva il blocco sui livelli che non devono essere modificati per evitare selezioni o interazioni non volute.
- Abilita le etichette solo per le classi che ti interessa identificare rapidamente, per non sovraccaricare la mappa.
- Se lo snap interferisce con il disegno delle geometrie o con le misure, disattivalo sulle classi con molti oggetti.
Pannello Inventory
Il Pannello Inventory (icona a forma di tabella) è lo strumento dedicato alla gestione e consultazione delle classi oggetto presenti nel progetto.
Cliccando sul nome di una classe oggetto nella lista si apre la relativa vista Inventory. Accanto al nome di ciascuna classe è mostrato lo stile applicato agli oggetti in mappa, utile per riconoscerli più facilmente. Per le classi di tipo Form, prive di geometria in mappa, compare invece l'icona Form: queste classi sono accessibili e consultabili solo dal pannello Inventory. Per le classi che hanno la funzione di creazione automatica degli oggetti attiva, è presente a fine riga l'icona corrispondente.
Per filtrare rapidamente le classi oggetto senza scorrere la lista completa, usa la barra di ricerca in cima al pannello.
Pannello Dashboard
Disponibile solo con sensori configurati in precedenza.
Il Pannello Dashboard (icona a forma di grafico a torta) permette di visualizzare i grafici associati agli oggetti selezionati ed è lo strumento dedicato all'analisi dei dati.
Quando non ci sono oggetti selezionati il pannello è vuoto. Si popola selezionando uno o più oggetti dalla vista 2D, 3D o Inventory, a condizione che abbiano attributi di tipo grafico.
I grafici vengono presentati incolonnati e raggruppati per oggetto: sopra ogni gruppo compare l'attributo principale dell'oggetto, seguito dai grafici a esso associati. Il processo si ripete per ciascun oggetto selezionato.
💡 Suggerimento: Selezionando più oggetti contemporaneamente puoi confrontare i grafici di vari oggetti.
Pannello Report
Il Pannello Report (icona a forma di documento) è lo strumento dedicato alla consultazione dei report configurati per il progetto.
Cliccando sul nome di un report nella lista si apre la relativa vista Report. I report disponibili sono raggruppati per categoria, rendendo più semplice individuare quello di interesse.
Per filtrare rapidamente i report senza scorrere la lista completa, usa la barra di ricerca in cima al pannello.
Collegamenti
Last update: 21 May 2026