App Features
The App Features guide covers all the operations performed within the EagleArca app.
It describes how to interact with the Home screen, how to access projects and navigate within them using 2D and 3D views, manage objects on the map, use the Layer, Inventory, and Dashboard panels, take measurements, and import shapes or external data.
It is designed for those who work in the field or manage data directly from projects, and clearly explains how to interact with the map and the system’s operational tools.
Il libro Funzionalità dell'app raccoglie tutte le operazioni che si svolgono all’interno dell'app di EagleArca.
Descrive come interagire sulla Home, come entrare nei progetti e in essi navigare nelle viste 2D e 3D, gestire gli oggetti sulla mappa, utilizzare i pannelli Layer, Inventory e Dashboard, eseguire misurazioni e importare shape o dati esterni.
È pensato per chi lavora sul campo o gestisce i dati direttamente dai progetti, e spiega in modo chiaro come interagire con la mappa e con gli strumenti operativi del sistema.
- Create a global object
- Create a global report
- Navigating between views
- Using panels
- Managing objects in the project
- Manage object relations
- Measuring in 2D and 3D views
- Customize the 3D view
- Import shape files
- Managing reports in the project
Create a global object
![]() English version
English version
Global Lists are object classes independent from projects, available at the organization level.
They are used to collect shared data, such as records, inventories or verification reports, accessible to multiple teams at all times.
To create, modify and view objects, access permissions to the App are required.
Create a global object
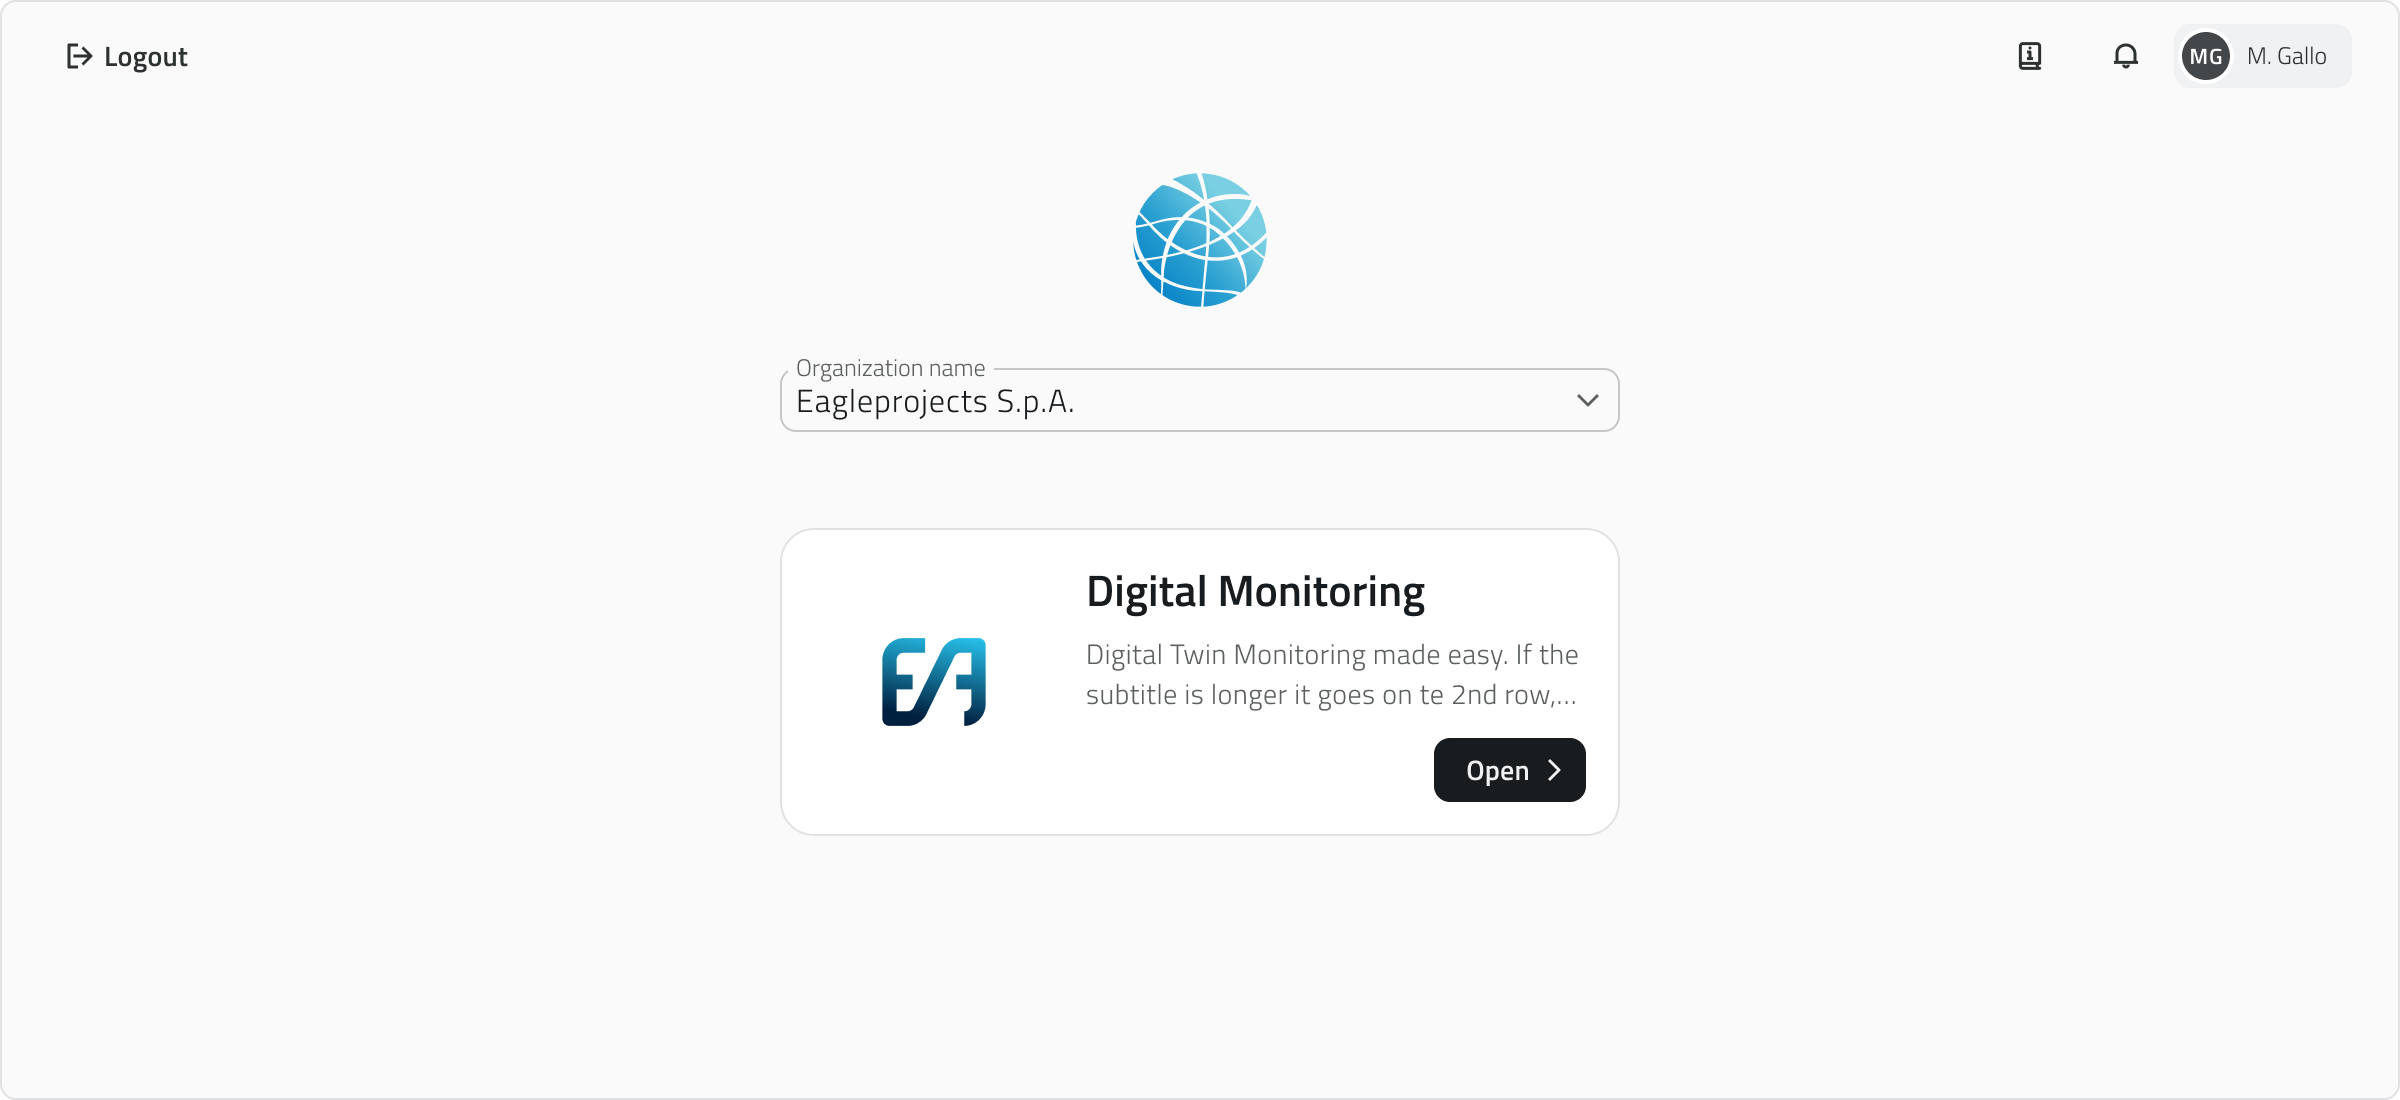
1. From the home screen, select your organization's app to access the workspace.
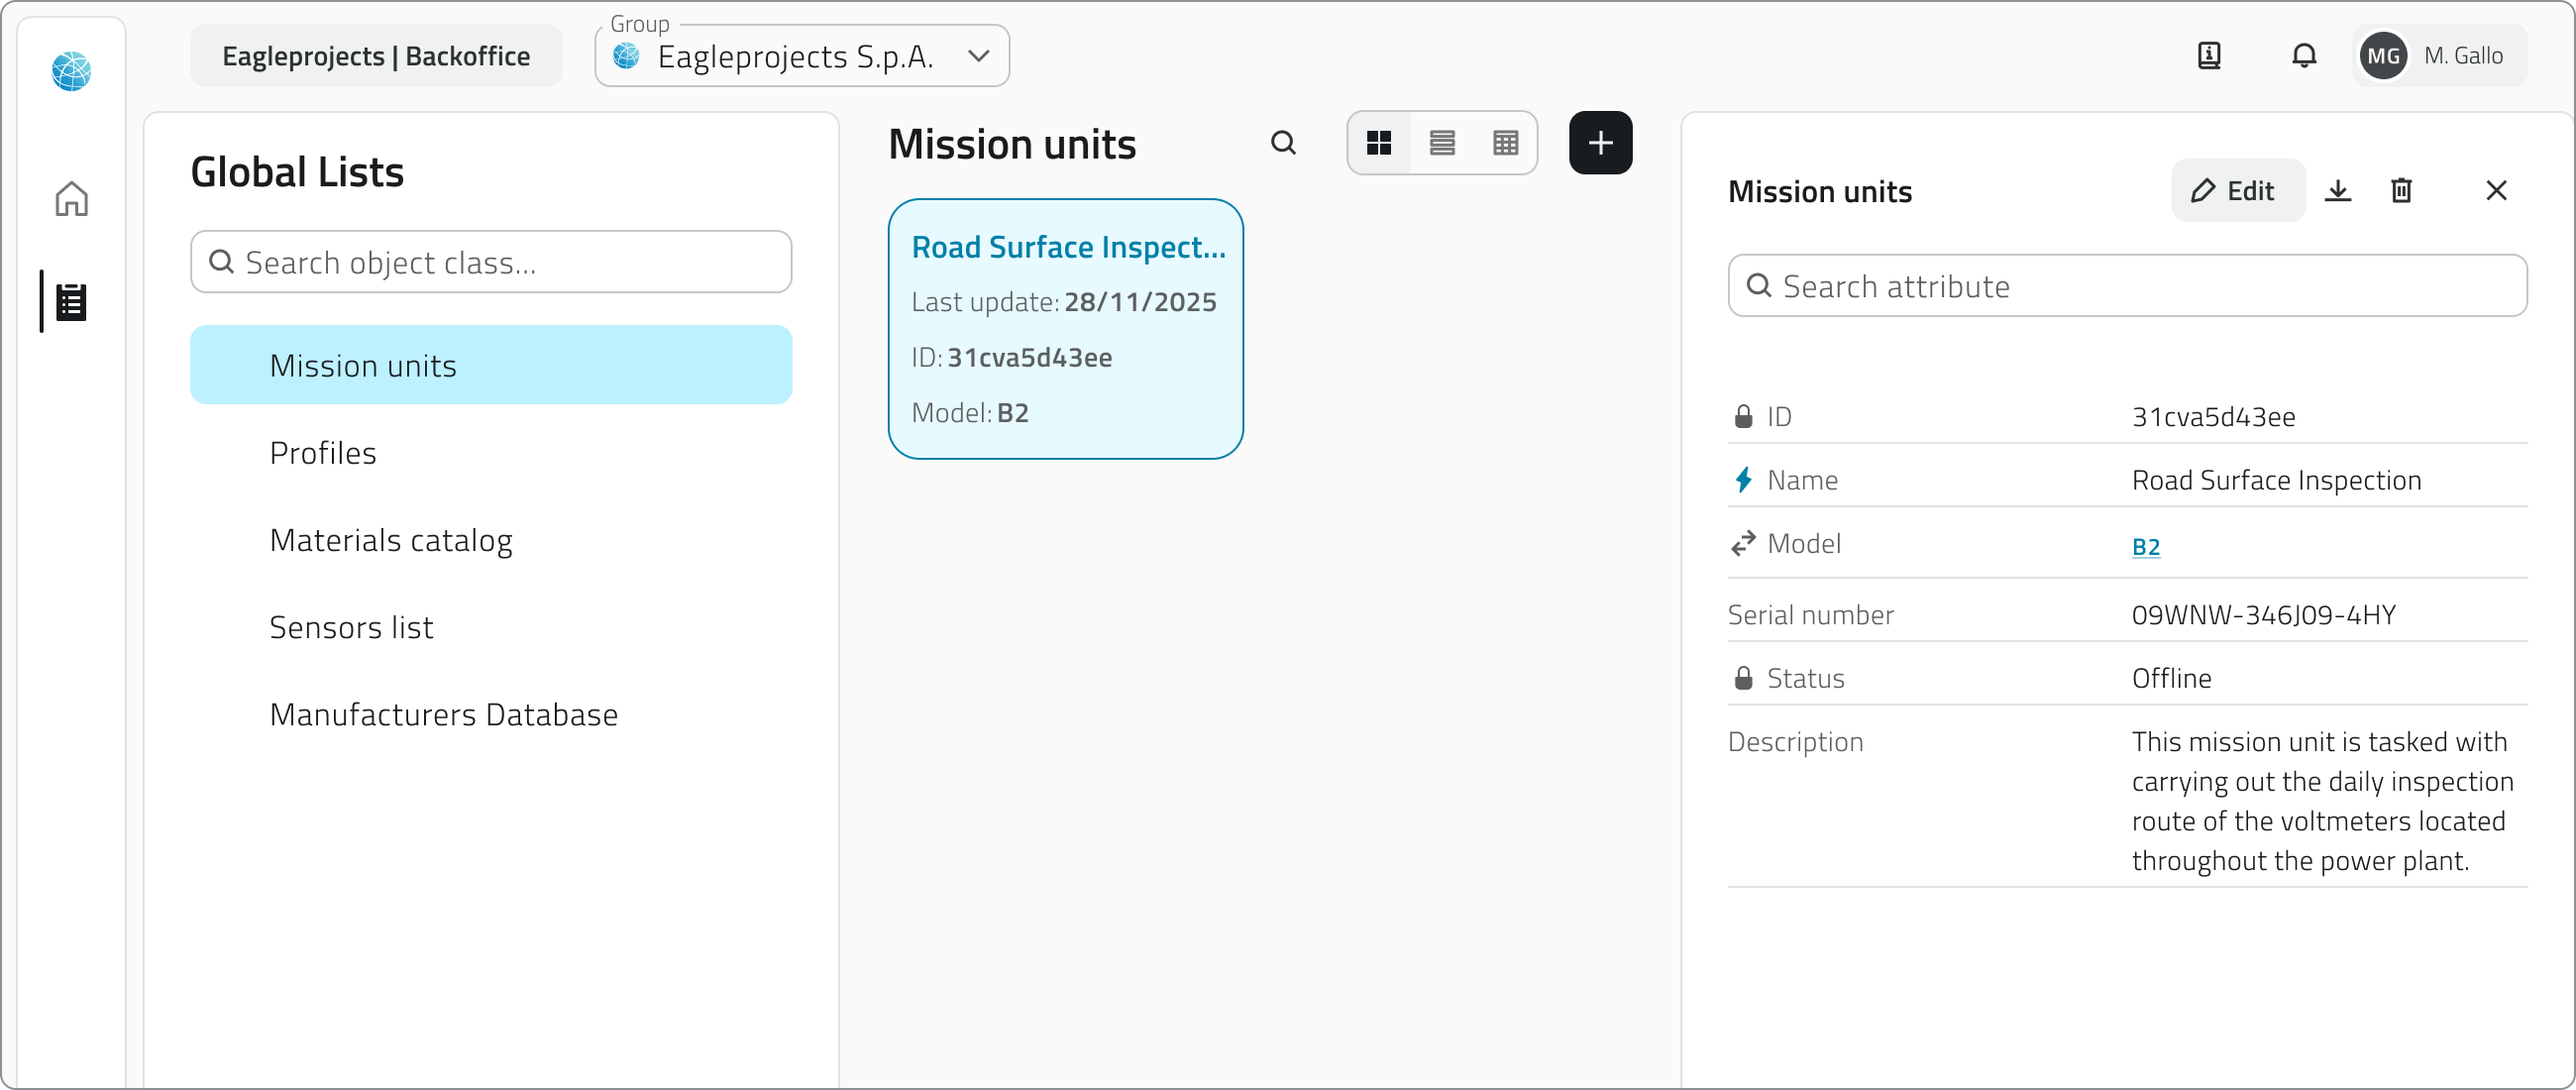
2. From the left-side menu, click Global Lists to view all available lists.
![]()
3. Choose a class from the list to open the associated objects. You can filter classes or objects using the search bar at the top. Objects can be displayed in grid, list or table mode.
4. Click New object in the top-right corner.
![]()
5. The object creation panel will open on the right, requiring you to fill in the attributes defined for that object class.
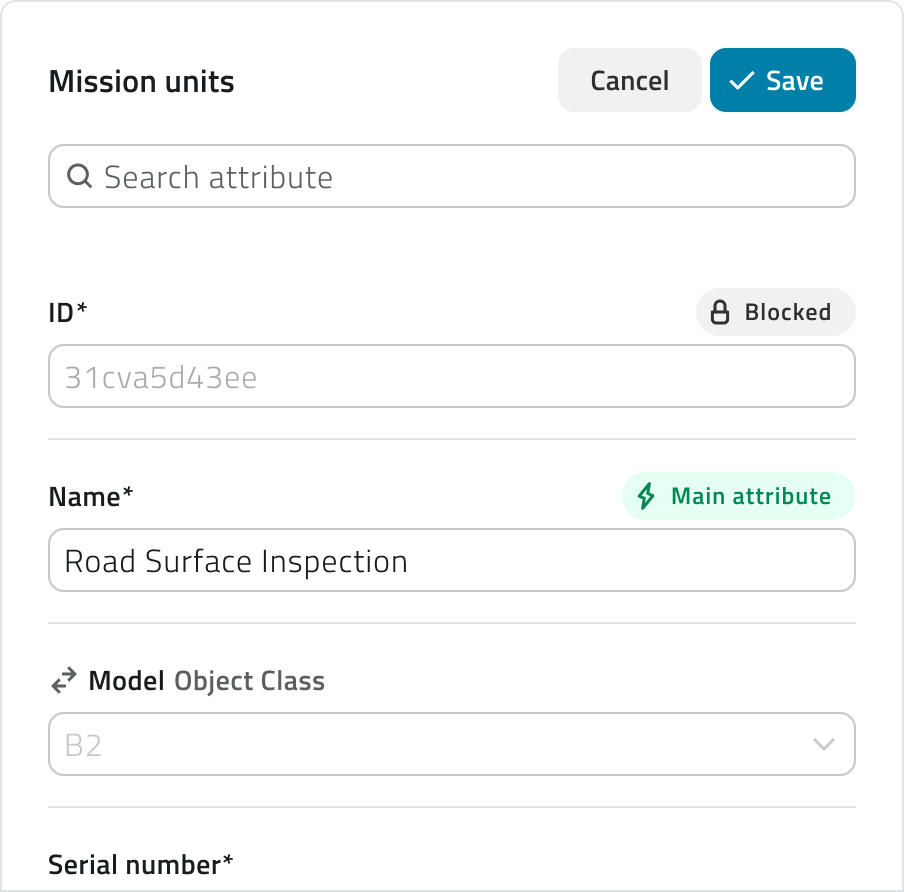
6. To create the object, click Save.
Editing objects
To open the Attribute details panel of an object, click the blue Open button that appears when hovering over the element. From here you can view, edit and download the attribute values.
To close the panel, click the ✕ in the top-right corner.
Edit
To edit an object, open the details by clicking the blue Open button that appears when hovering over the element, then click Edit.
Delete
To delete an object, open the Attribute details panel and click the Delete button, then confirm the operation. Alternatively, select one or more objects from the list: the Delete button will appear in the top-right corner of the view.
Creating, editing and deleting are available only if you have edit permissions for that object class.
Links
![]() Italian version
Italian version
Le Liste Globali sono Classi Oggetto indipendenti dai progetti, disponibili a livello di organizzazione.
Servono per raccogliere dati condivisi, come anagrafiche, inventari o rapporti di verifica, consultabili da più team e sempre accessibili.
Per creare, modificare e visualizzare gli oggetti sono necessari i permessi di accesso all'App.
Creare un oggetto globale
1. Dalla schermata iniziale, seleziona l'app della tua organizzazione per accedere all'ambiente di lavoro.
2. Dal menu laterale sinistro, clicca su Liste Globali per visualizzare tutte le liste disponibili.
![]()
3. Scegli una classe dall'elenco per aprire la lista degli oggetti associati.
Puoi filtrare le classi o gli oggetti usando la barra di ricerca in alto.
Gli oggetti possono essere visualizzati in modalità griglia, lista o tabella.
4. Clicca su Nuovo oggetto in alto a destra.
![]()
5. Si aprirà il pannello laterale di creazione degli oggetti, che richiede la compilazione degli attributi definiti per quella classe oggetto.
6. Per creare l'oggetto, clicca Salva.
Modifica degli oggetti
Per aprire il pannello Dettaglio attributi di un oggetto, clicca il pulsante blu Apri che compare al passaggio del mouse sull'elemento. Da qui puoi consultare i valori degli attributi, modificarli e scaricare i dati.
Per chiudere il pannello, clicca sulla ✕ in alto a destra.
Modifica
Per modificare un oggetto, apri il dettaglio cliccando il pulsante blu Apri che compare al passaggio del mouse sull'elemento, quindi clicca Modifica.
Elimina
Per eliminare un oggetto apri il pannello Dettaglio attributi e clicca il pulsante Elimina, quindi conferma l'operazione. In alternativa, seleziona uno o più oggetti dall'elenco: comparirà il pulsante Elimina in alto a destra della vista.
La creazione, la modifica e l'eliminazione sono disponibili solo se si dispone dei permessi di modifica per quella classe oggetto.
Collegamenti
Last update: 21 May 2026
Create a global report
![]() English version
English version
Global Reports are reports independent from projects, available at the organization level. The data collected for each report refers to all projects present in the platform, or to data that is independent from projects altogether, such as user access logs.
They are generated from predefined templates and can be downloaded in the available formats.
To generate and view reports, you need access permissions for the App and view or edit permissions for that template.
Generate a global report
1. From the home screen, select your organization's app to access the workspace.
![]()
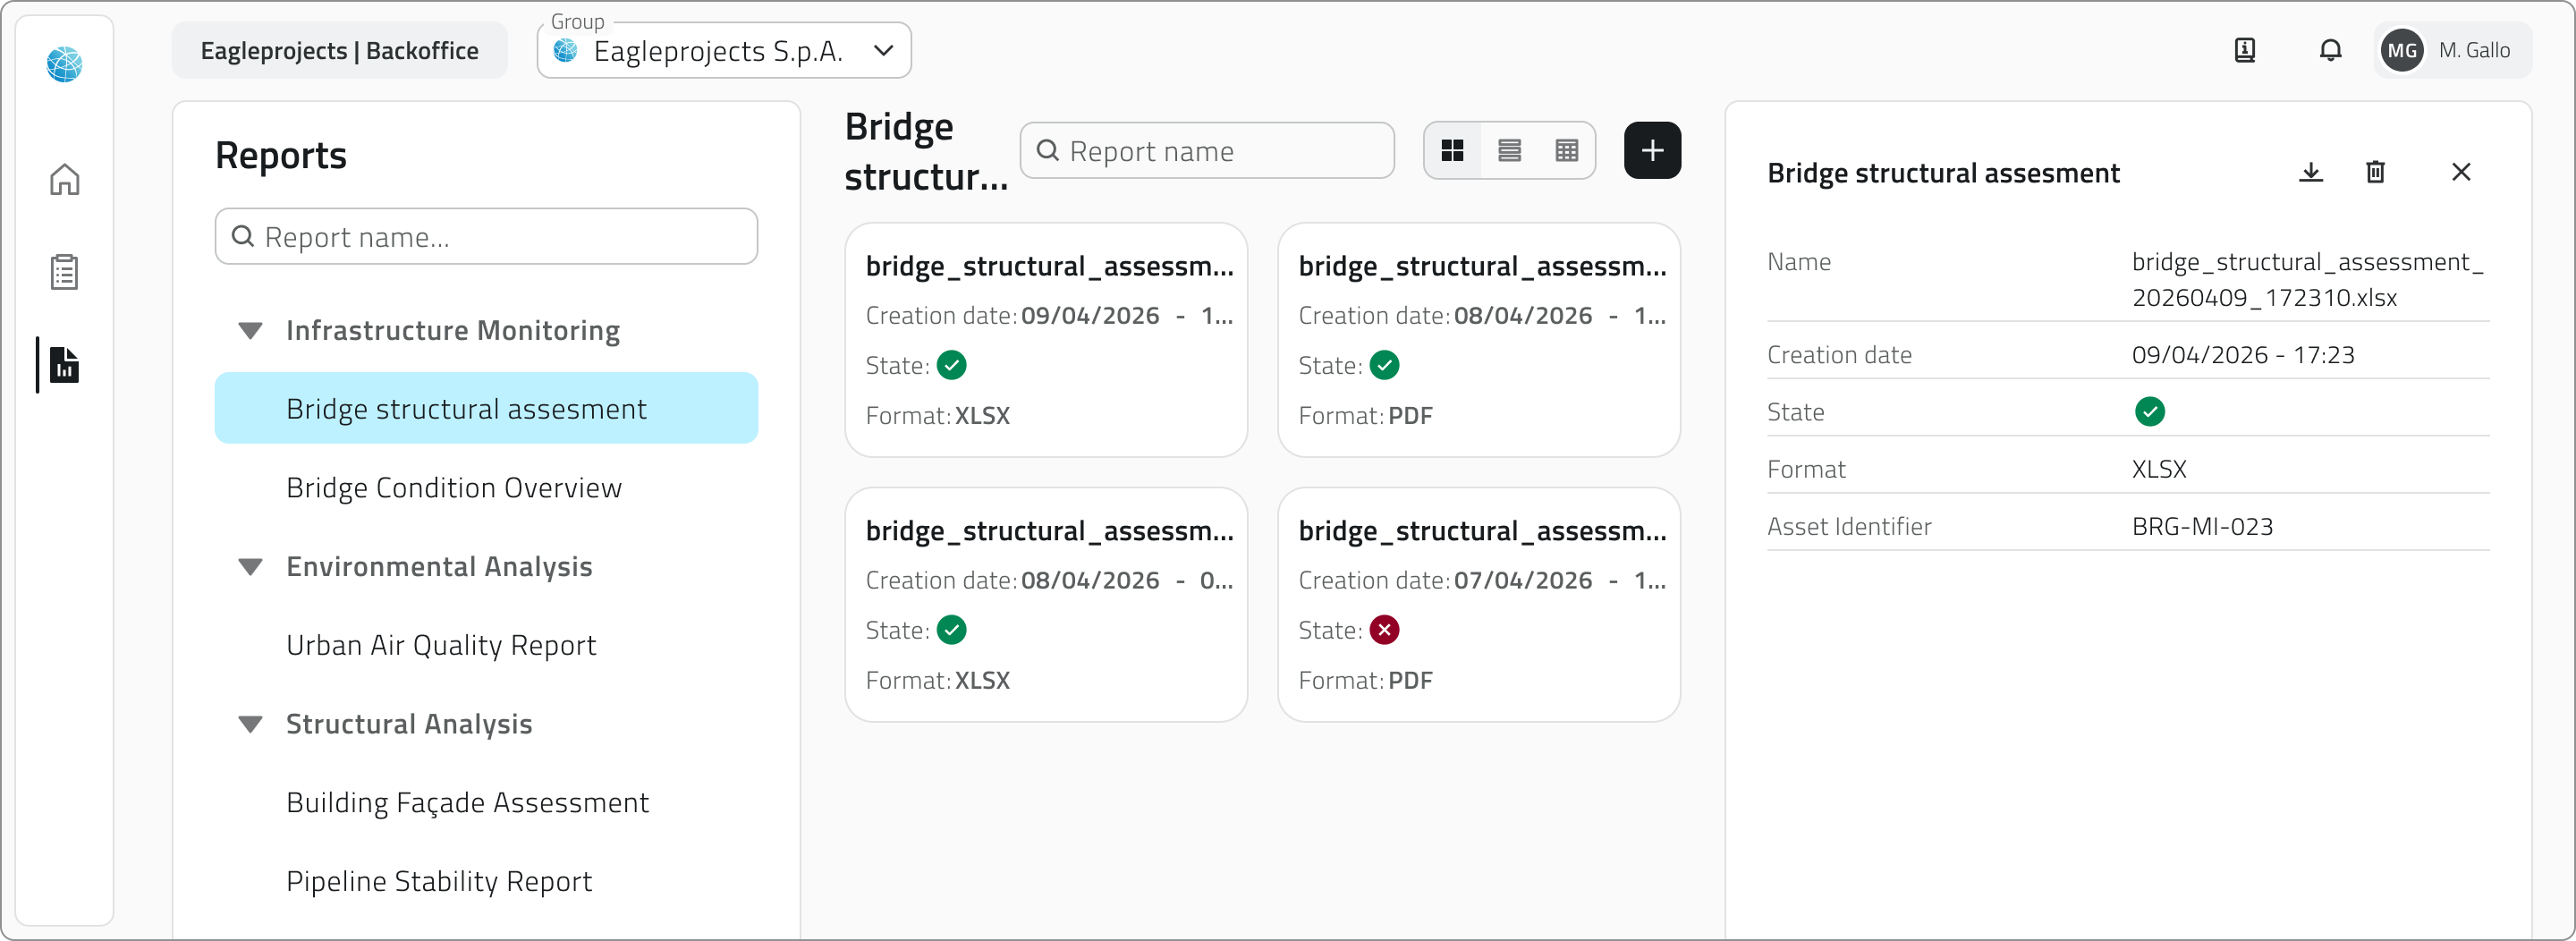
2. From the left-side menu, click Reports to view all available report templates.
![]()
3. Select the desired template from the list to open the Report page. You can filter reports using the search bar at the top. Elements can be displayed in grid, list or table mode.
4. Click the Generate report button in the top-right corner.

5. A configuration panel opens on the right side of the page, requiring:
- the selection of a format from those available, configured in the Backoffice;
- the completion of any filters, which vary depending on the selected template and refine the report content.
Some filters may be mandatory.
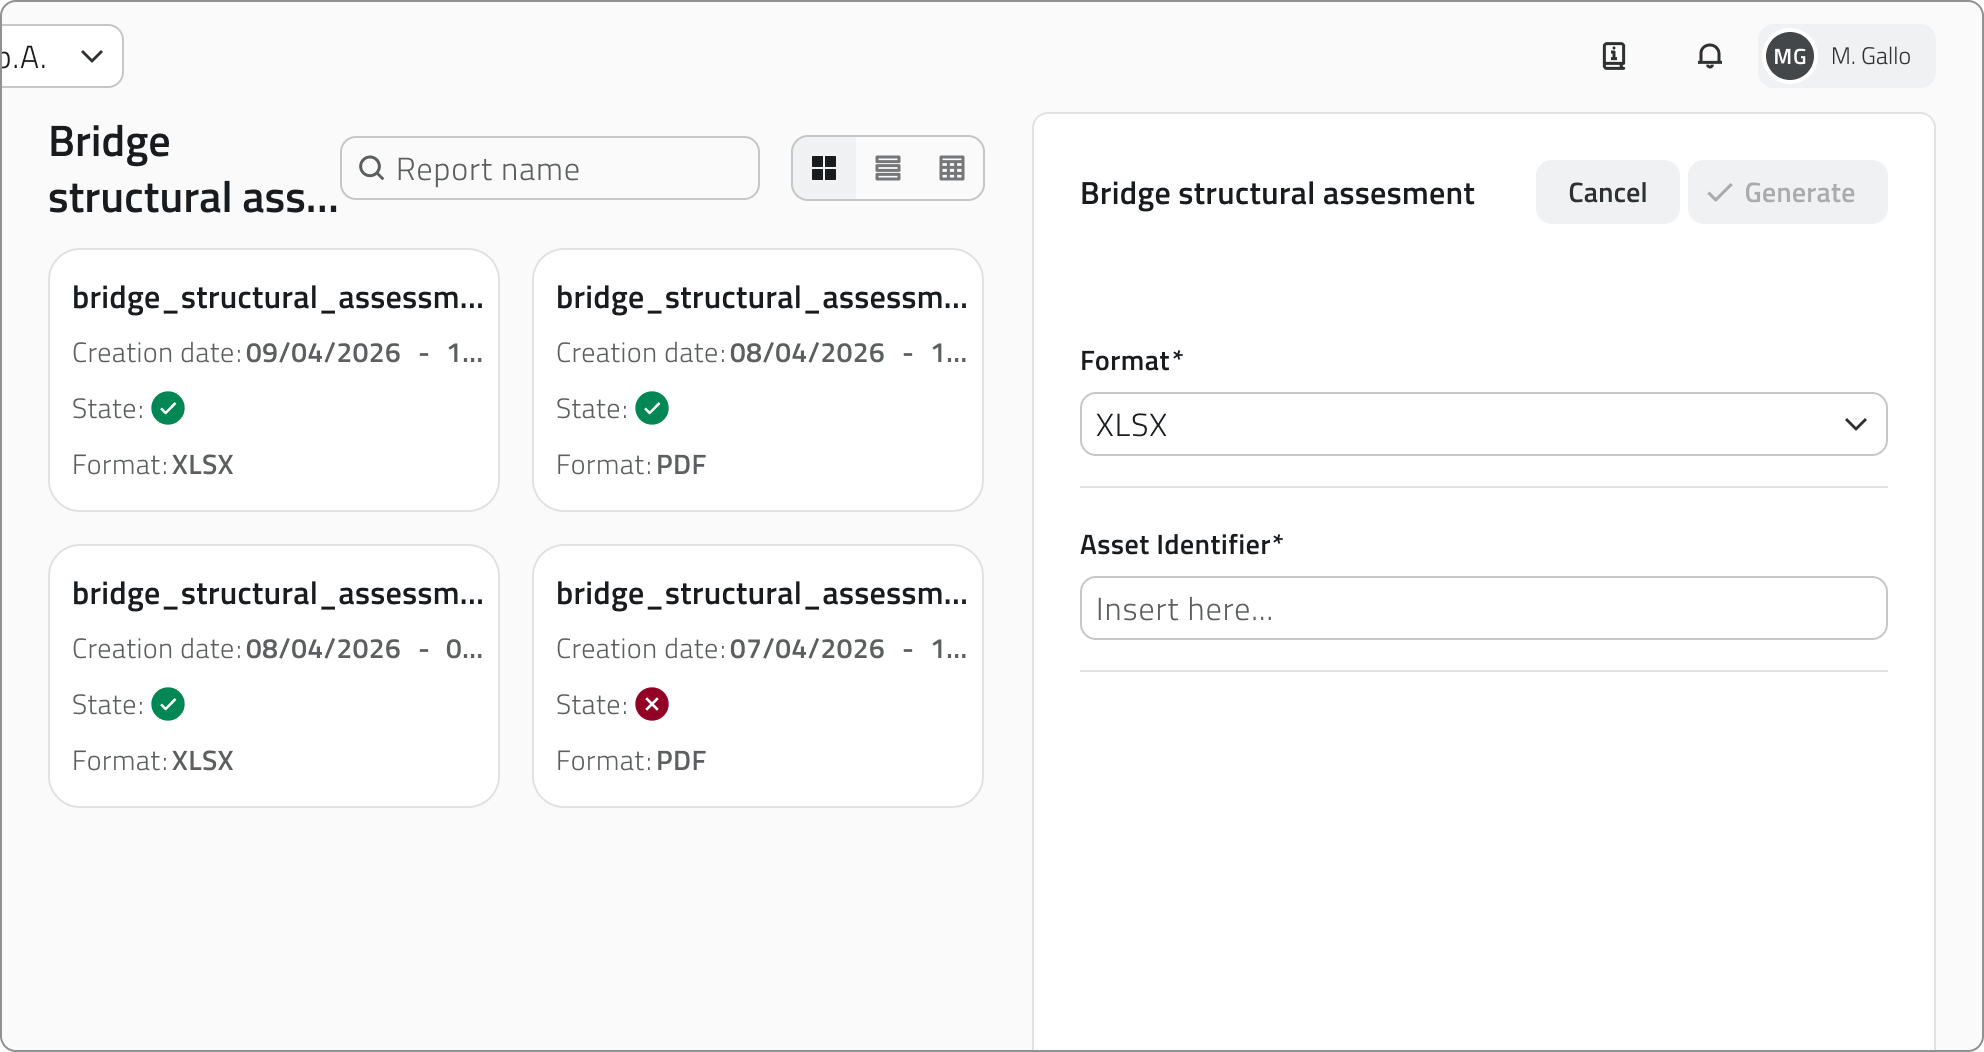
6. Click Confirm to start the generation, or Cancel to close the window without proceeding.
Report generation takes a few moments. Do not leave the page during the process. The progress status is visible directly in the report row, where the download button shows a spinner until completion.
Report information
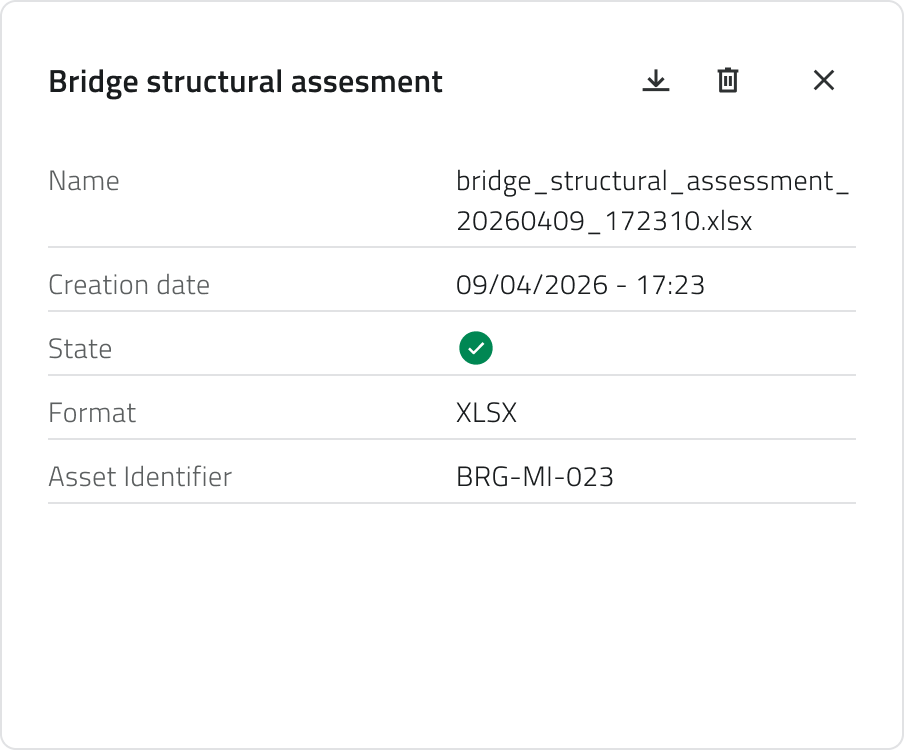
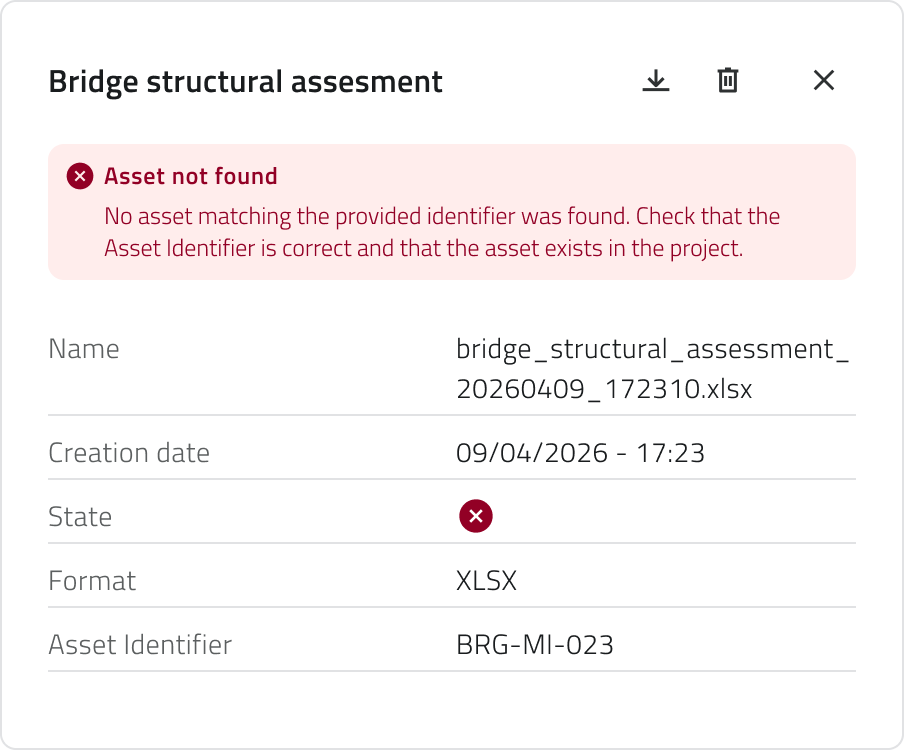
Once generation has started, the following information is shown for each element in the page:
- Name of the report
- Creation date (empty until generation is complete)
- Status (success or error; empty if generation has not yet concluded)
- Selected format
- Filters entered during configuration
Downloading and viewing a report
Once generation is complete, the report can be downloaded using the download button on the element row. Alternatively, clicking the blue Open button that appears when hovering over the element opens the report details, which shows all associated information.
If generation did not complete successfully, the error message is visible at the top of the report details.
Reports cannot be edited after generation.
Deleting a report
To delete a report, open the report details and click the Delete button, then confirm the operation. Alternatively, select one or more reports from the list: the Delete button will appear in the top-right corner of the page.
Generating and deleting global reports is only available if you have edit permissions for that report template.
Links
![]() Italian version
Italian version
I Report Globali sono report indipendenti dai progetti, disponibili a livello di organizzazione. I dati raccolti per ogni report fanno riferimento a tutti i progetti presenti in piattaforma, oppure a dati che prescindono dai progetti, come ad esempio gli accessi degli utenti.
Vengono generati a partire da template predefiniti e possono essere scaricati nei formati disponibili.
Per generare e visualizzare i report sono necessari i permessi di accesso all'App e i permessi di visualizzazione o modifica per quel template.
Generare un report globale
1. Dalla schermata iniziale, seleziona l'app della tua organizzazione per accedere all'ambiente di lavoro.
![]()
![]()
3. Seleziona il template desiderato dalla lista per aprire la pagina Report. Puoi filtrare i report usando la barra di ricerca in alto. Gli elementi possono essere visualizzati in modalità griglia, lista o tabella.
4. Clicca sul pulsante Genera report in alto a destra.
5. Si apre un pannello di configurazione sul lato destro della pagina, che richiede:
- la scelta di un formato tra quelli disponibili, configurati nel Backoffice;
- la compilazione degli eventuali filtri, che variano in base al template selezionato e affinano il contenuto del report. Alcuni filtri possono essere obbligatori.

6. Clicca Conferma per avviare la generazione, oppure Annulla per chiudere la finestra senza procedere.
Il pulsante Conferma è disabilitato finché tutti i filtri obbligatori non sono stati compilati.
La generazione del report richiede alcuni istanti. Non lasciare la pagina durante il processo. Lo stato di avanzamento è visibile direttamente nella riga del report, dove il pulsante di download mostra uno spinner fino al completamento.
Informazioni del report
Una volta avviata la generazione, nella pagina vengono mostrate le seguenti informazioni per ogni elemento:
- Nome del report
- Data di creazione (vuota fino al completamento della generazione)
- Stato (successo o errore; vuoto se la generazione non è ancora conclusa)
- Formato selezionato
- Filtri inseriti in fase di configurazione
Scaricare e consultare un report
Al termine della generazione il report può essere scaricato tramite il pulsante di download presente sulla riga dell'elemento. In alternativa, cliccando sul pulsante blu Apri che compare al passaggio del mouse sull'elemento si apre il dettaglio report, che mostra tutte le informazioni associate.
Se la generazione non è andata a buon fine, il messaggio di errore è visibile in cima al dettaglio del report.
I report non possono essere modificati dopo la generazione.
Eliminare un report
Per eliminare un report apri il dettaglio report e clicca il pulsante Elimina, quindi conferma l'operazione. In alternativa, seleziona uno o più report dalla lista: comparirà il pulsante Elimina in alto a destra della pagina.
La generazione e l'eliminazione dei report globali sono disponibili solo se si dispone dei permessi di modifica per quel template di report.
Collegamenti
Last update: 11 June 2026
Navigating between views
![]() English version
English version
The project offers several views for interacting with objects and data: 2D Map, 3D Map, Inventory, Reports and Streaming.
Opening and closing views
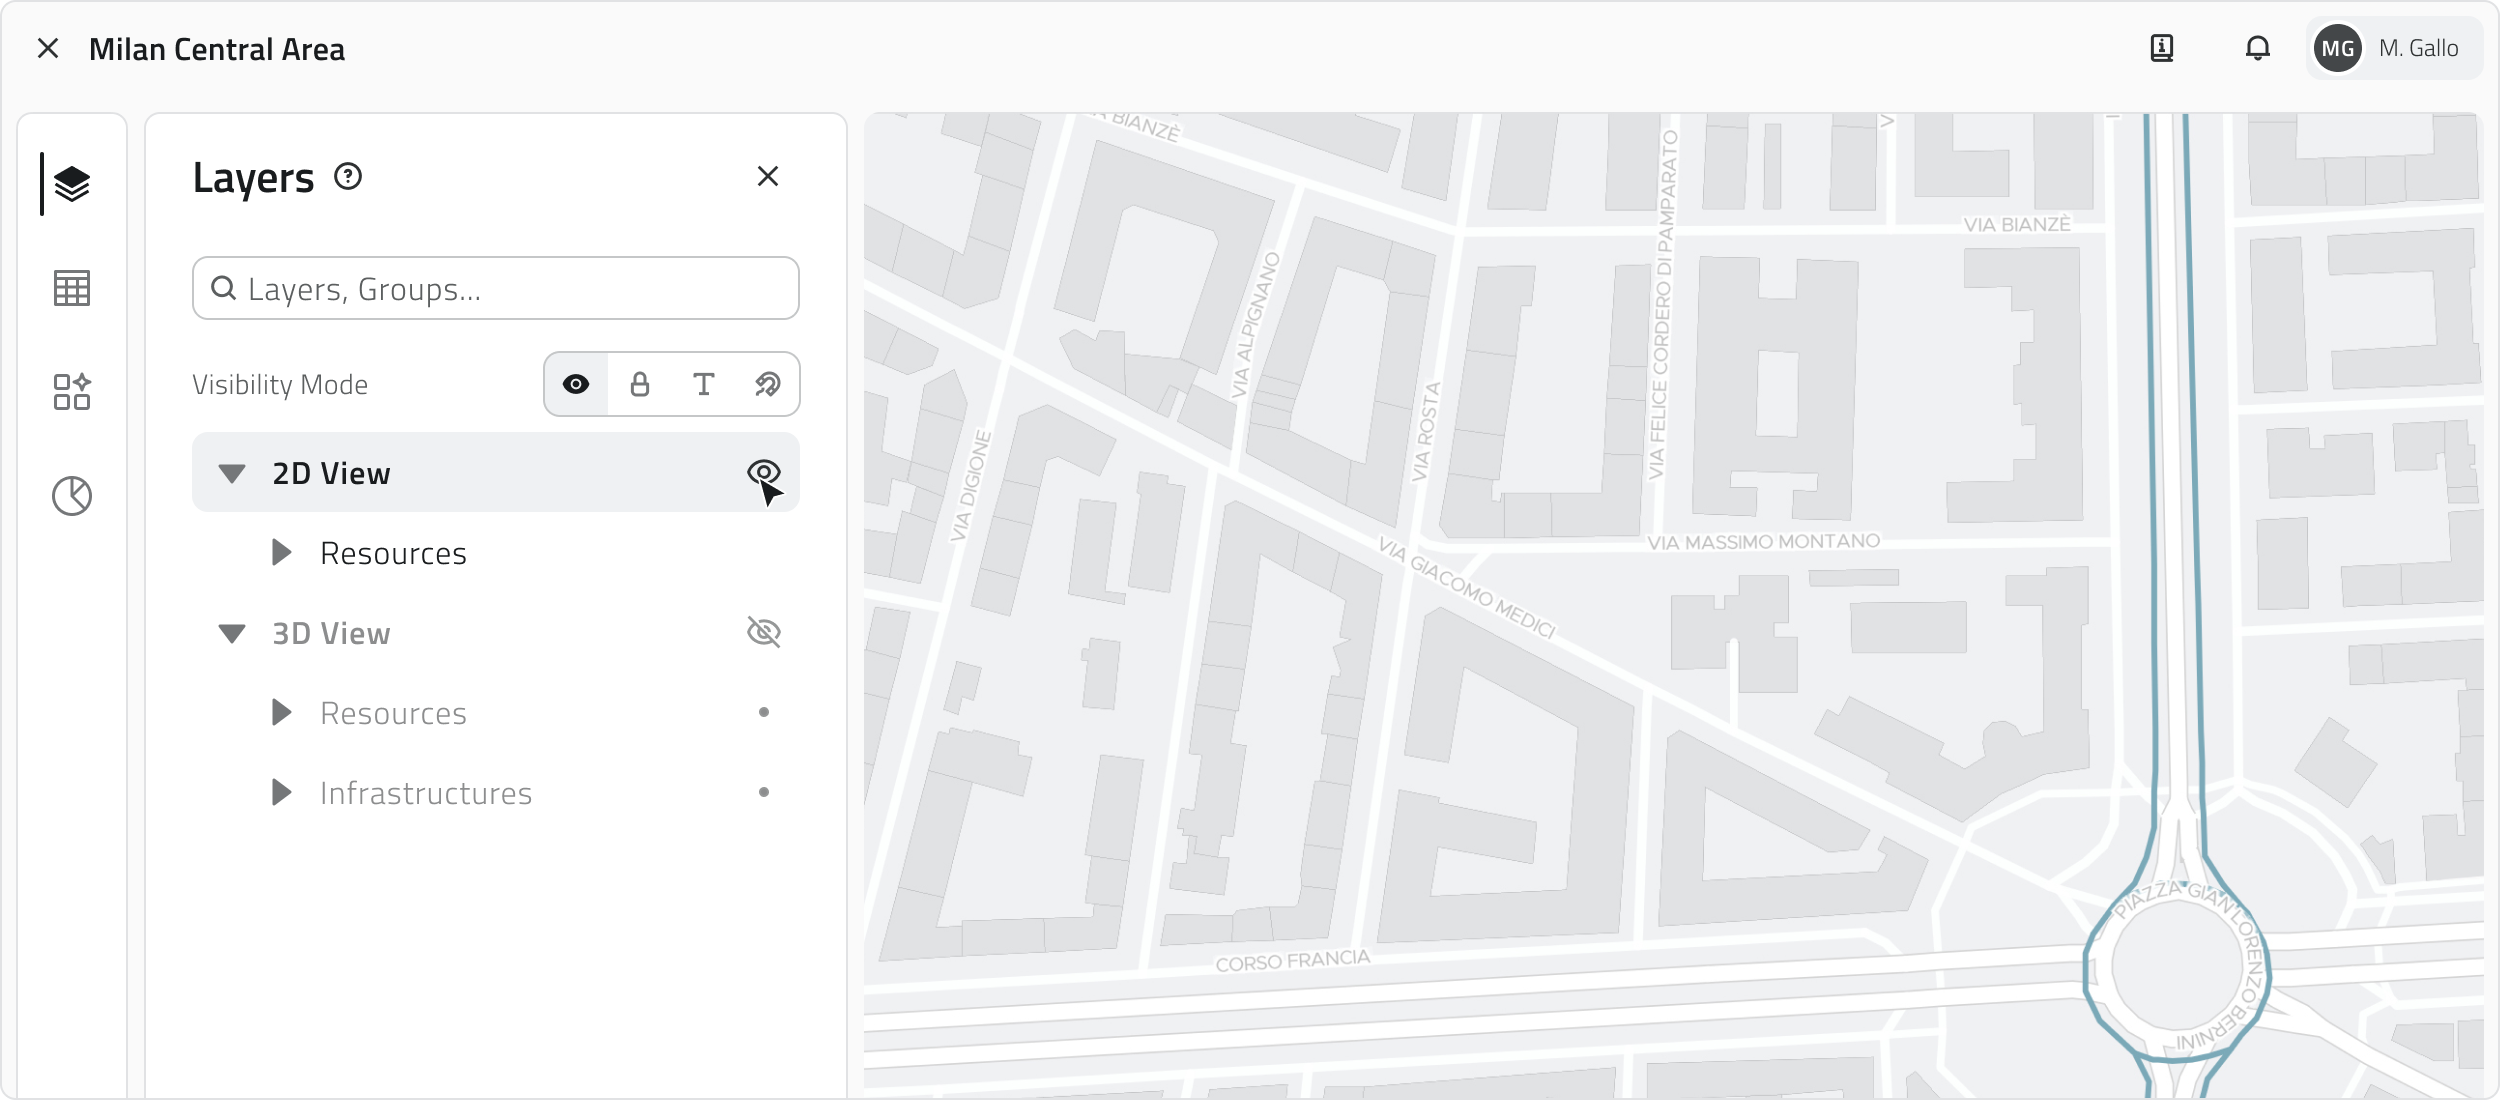
When a project is opened, some views open automatically. Clicking the Layers icon in the left sidebar opens the corresponding panel, from which you can show or hide individual views and object classes using the eye icon.
Navigation and object display
Vector objects are visible in both the 2D and 3D views, regardless of where they were created. In both views, objects are georeferenced and maintain the same geographic position within the workspace. Objects displayed in the 2D map are represented as flat elements on a plane, while in the 3D view they are placed in three-dimensional space.
Some automatically created objects may only be visible in the 2D view.
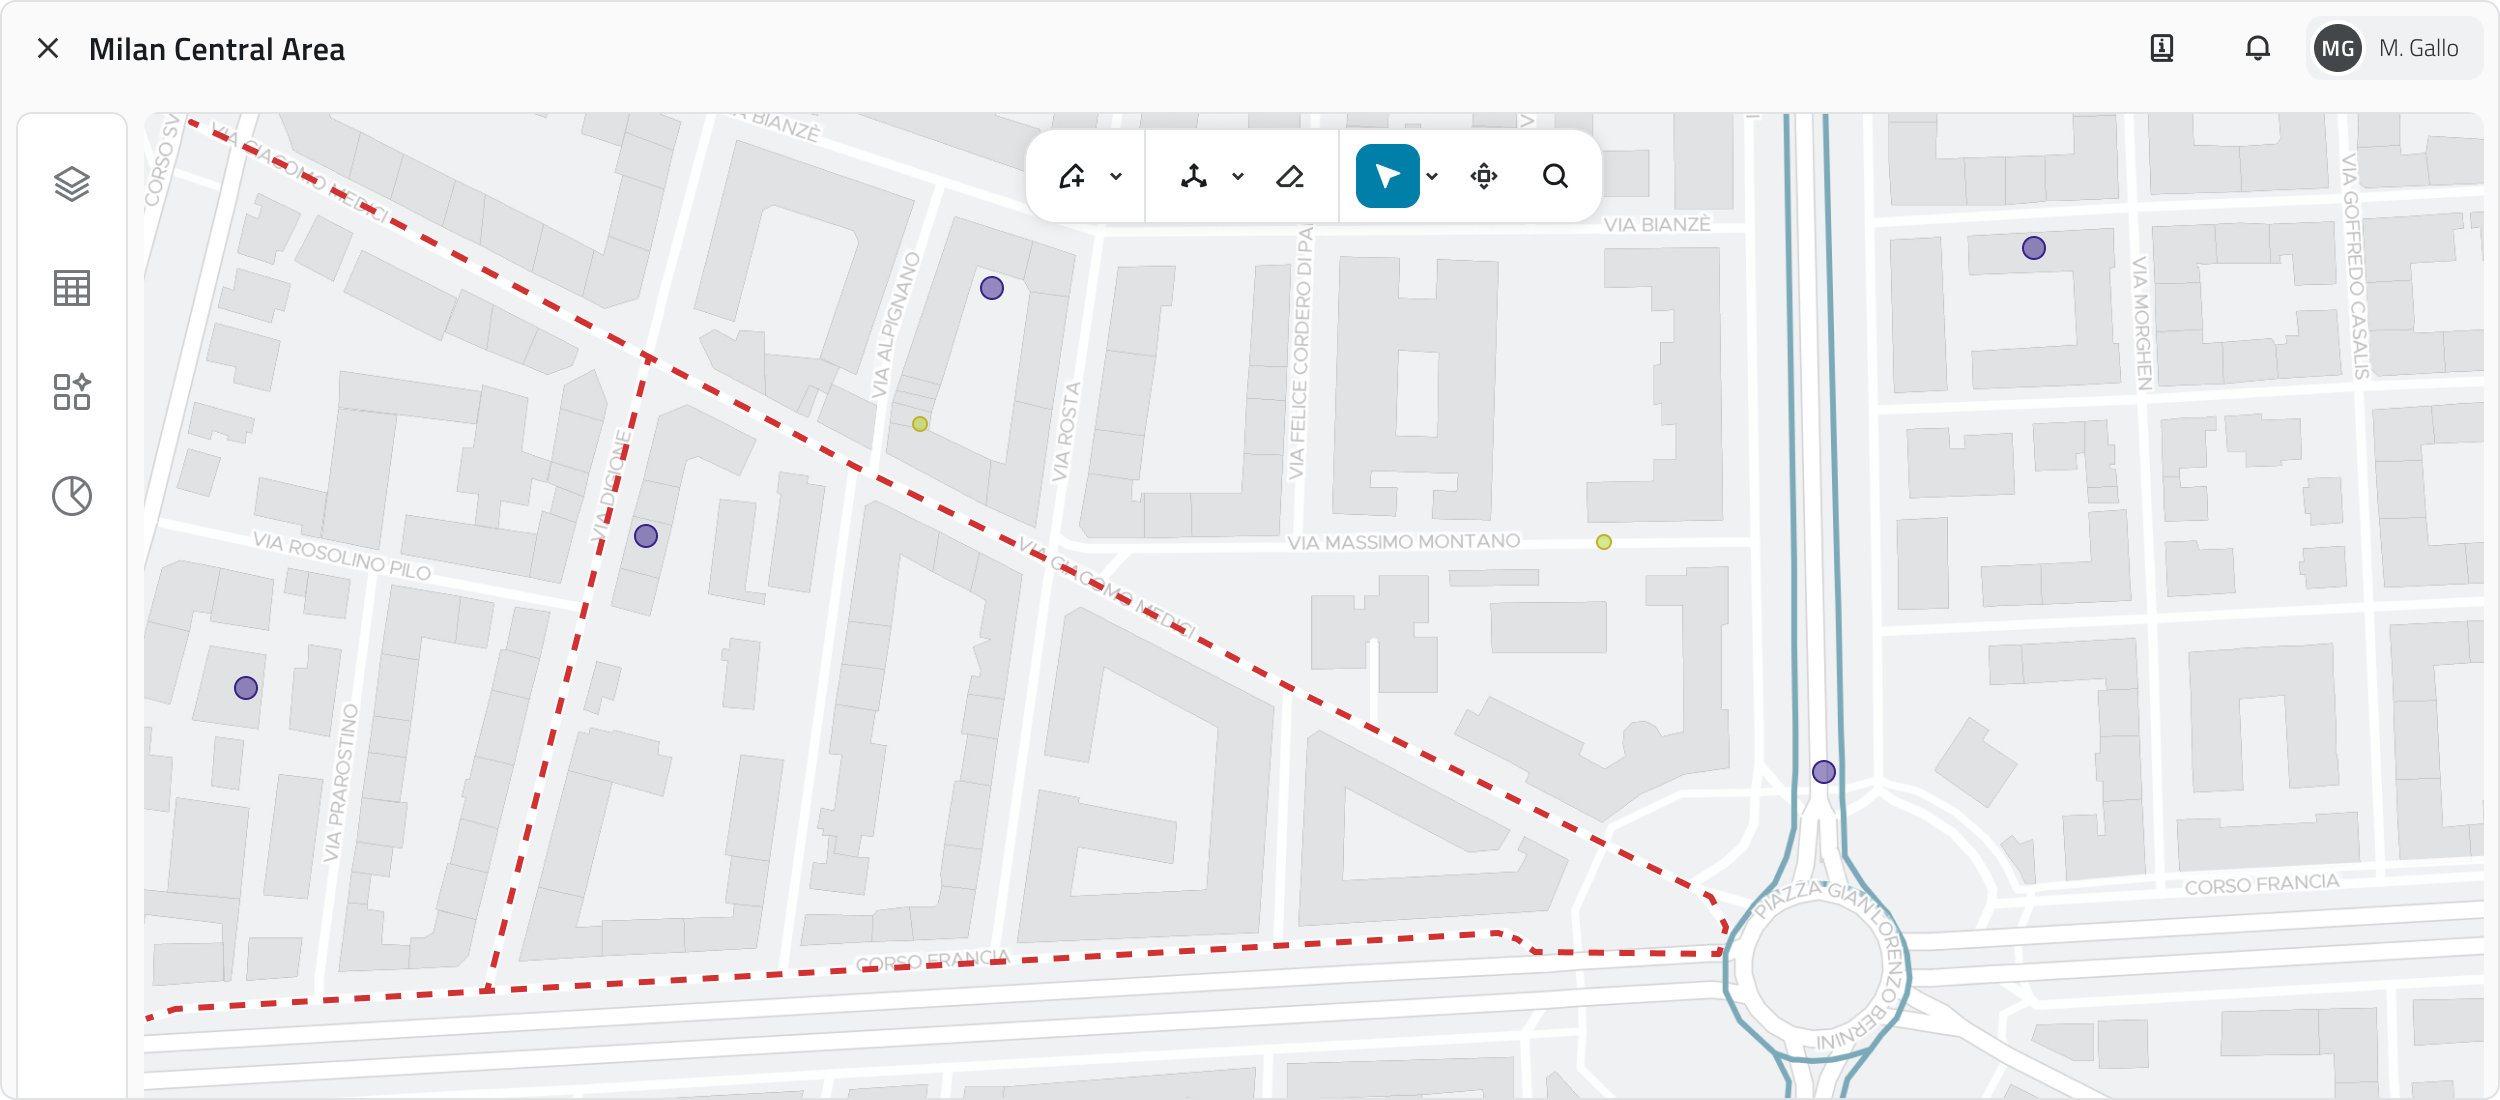
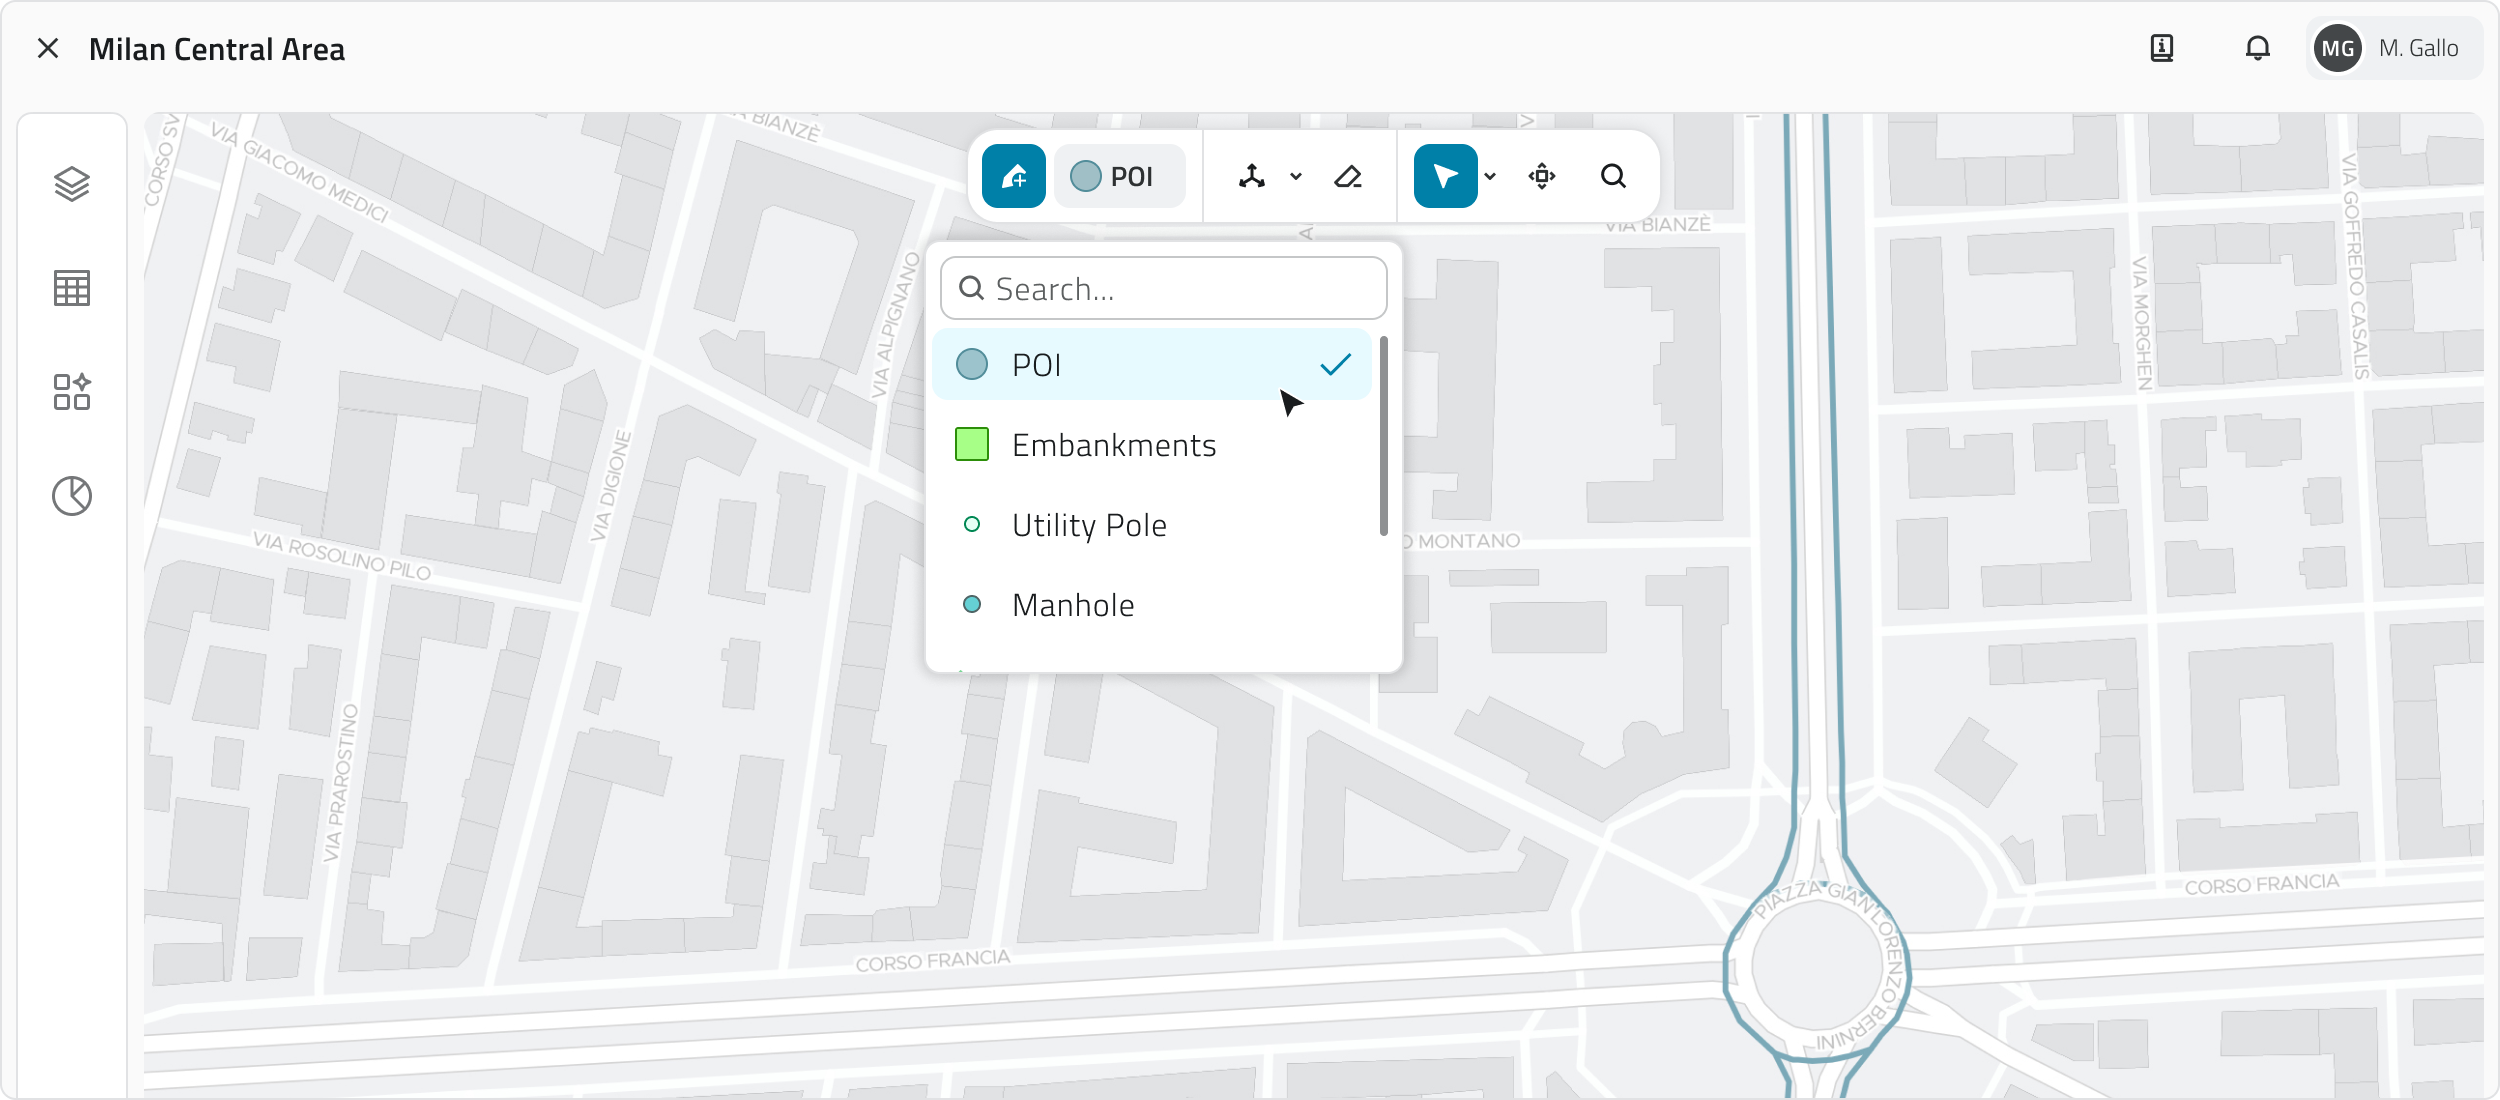
You can quickly locate a position in the 2D map by hovering over the view: the toolbar will appear, from which you can click the Search button (magnifying glass icon).
A search bar will open where you can type an address or the name of a city. As you type, the system automatically shows suggested results.
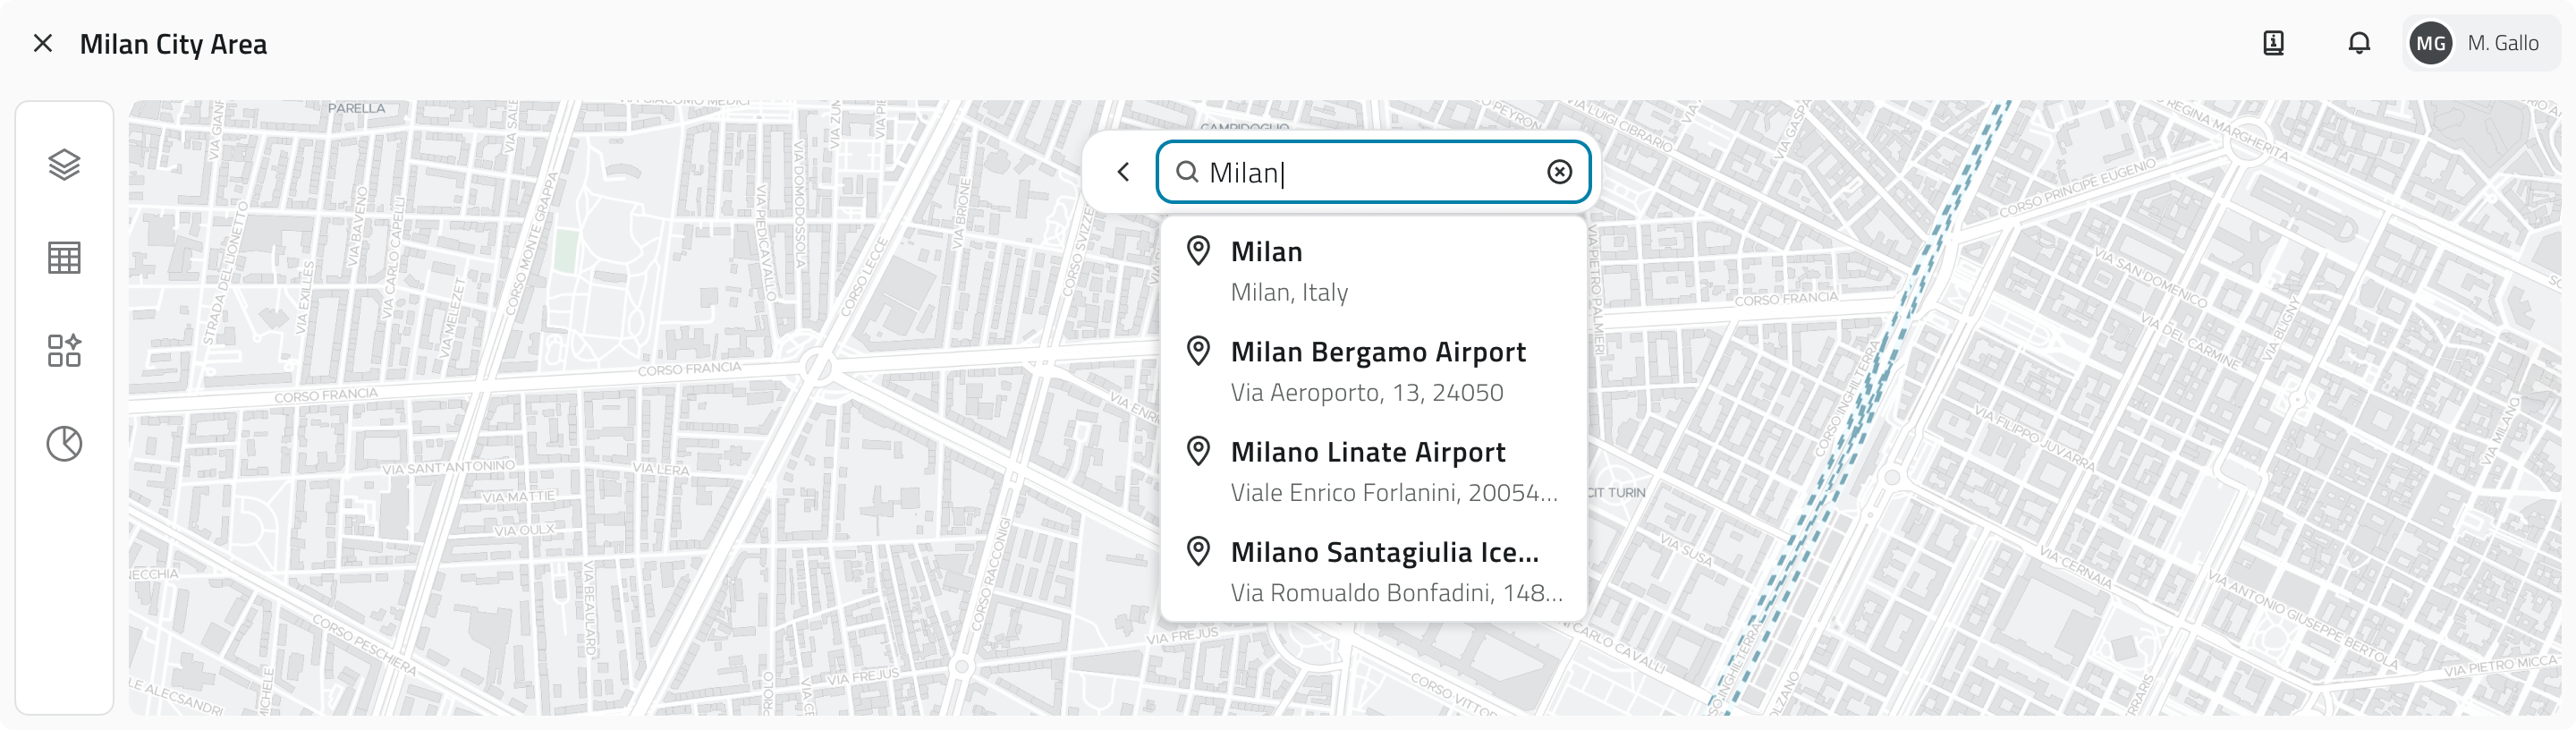
Select one of the suggested results to centre the map on the chosen location.
2D GIS View
Shows the georeferenced map of the project and its objects.
Useful for territorial exploration and verifying the position of assets.
The position indicator, shown in blue on the 2D map, displays the point where the 3D view camera is oriented.
Navigation
| Action | Control |
| Zoom in/out | Mouse wheel / + and – buttons at the bottom right |
| Pan | Hold and drag the left mouse button / mouse wheel |
| Move 3D view |
Move 3D View button |
| Base map | Selector at the bottom left (satellite, street, etc.) |
| Hide view | Button with eye icon at the bottom right |
Toolbar
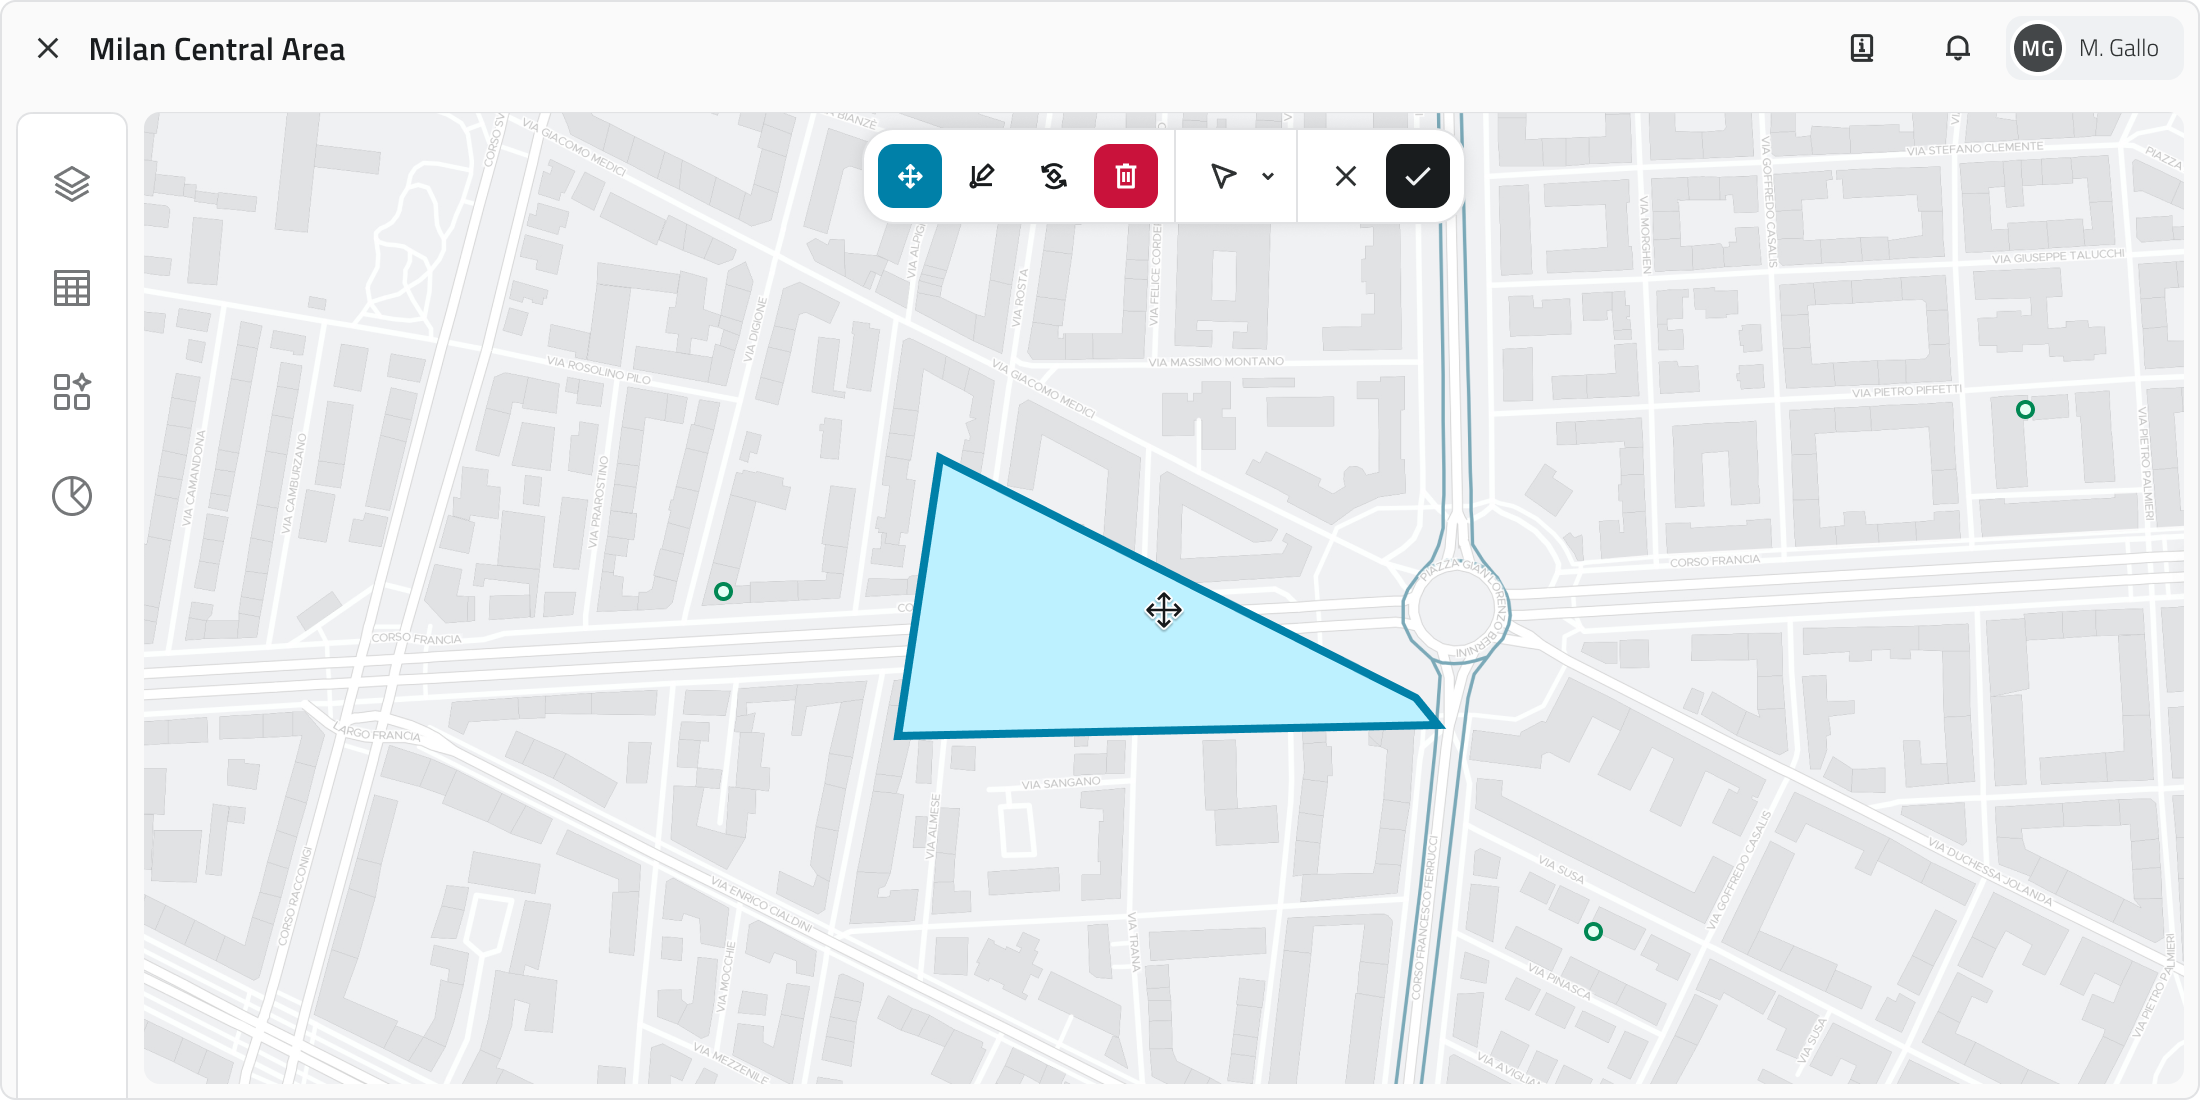
Hover over the 2D view to reveal the toolbar at the top of the view. The available tools are:
| Tool | Function |
| Draw | Select the desired object class to draw a new object |
| Measure | Choose the measurement type to measure distances or areas |
| Select | Choose the selection mode to select one or more objects |
| Move 3D view | Position the position indicator at the desired point to move the 3D camera |
| Search | Search for an address or city to centre the map on that location |
Object selection
Use the Select tool (active by default in Cursor mode on opening). Click the arrow next to the Select button to access the available modes.
| Mode | Action |
| Cursor | Click with the left mouse button to select a single object. Hold SHIFT and click to add or remove objects from the selection. Right-click to manage overlapping objects: if present, a window listing them all will open. |
| Bounding Box | Click and drag with the left mouse button to select all objects within the drawn rectangle. |
| Polygon | Click with the left mouse button to place the polygon vertices. Right-click to close it and select all objects inside. |
| Existing polygon | Click with the left mouse button on an existing polygon on the map to select it along with all objects contained within it. |
Opening object details
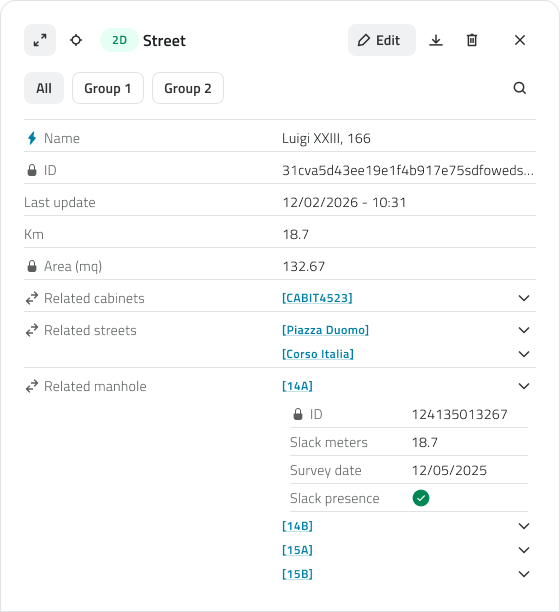
To open the Attribute details panel for an object, select it on the map: an info card will appear showing the object class, the main attribute and a label indicating the creation view. Click the Expand button (double arrow icon) to open the full panel.
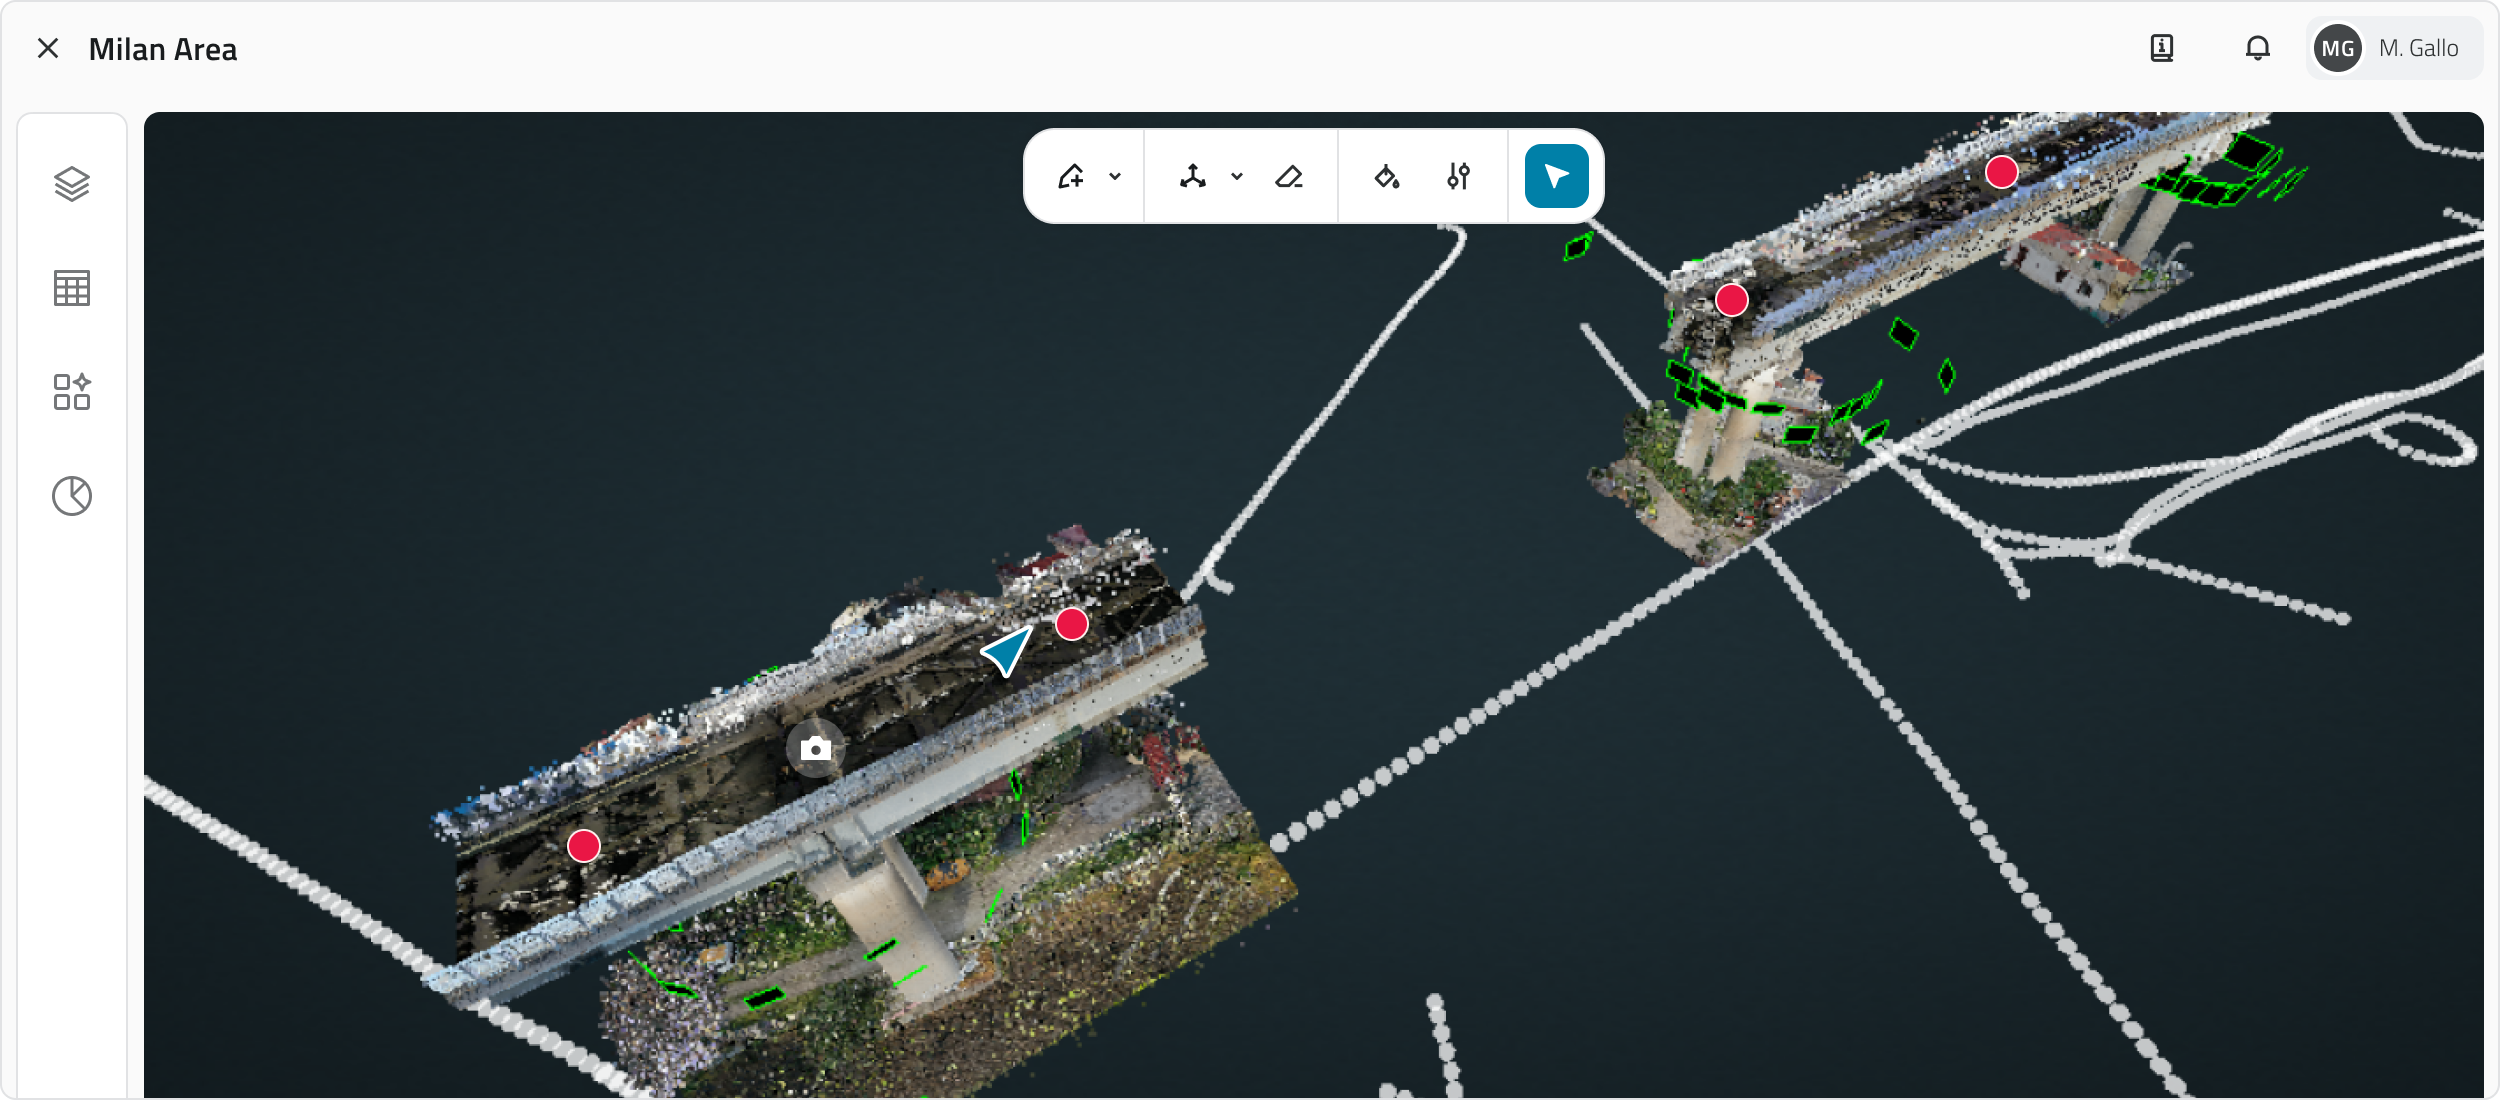
3D view
Navigation
| Action | Control |
| Rotate view | Hold and drag the left mouse button |
| Zoom in/out | Mouse wheel |
| Movement (Forward/Backward/Left/Right) | W A S D keys |
| Movement (Up/Down) |
Arrow keys |
| Lateral pan | Hold and drag the right mouse button / mouse wheel |
| Hide view | Button with eye icon at the bottom right |
💡 Tip: combine mouse and keyboard when navigating the 3D view for more precise movement.
Toolbar
Hover over the 3D view to reveal the toolbar at the top of the view. The available tools are:
| Tool | Function |
| Draw | Select the desired object class to draw a new object |
| Measure | Choose the measurement type to measure distances or areas |
| Export point cloud | Select a section of the point cloud and export it |
| Style | Modify the scene display style |
| Settings | Modify the navigation speed in the 3D view |
| Select | Choose the selection mode to select one or more objects |
The Style and Settings tools are useful for customising the 3D View.
Object selection
Use the Select tool (active by default on opening).
| Mode | Actions |
| Cursor | Click with the left mouse button to select a single object. Hold SHIFT and click to add or remove objects from the selection. |
Opening object details
To open the Attribute details panel for an object, select it on the map: an info card will appear showing the object class, the main attribute and a label indicating the creation view. Click the Expand button (double arrow icon) to open the full panel.
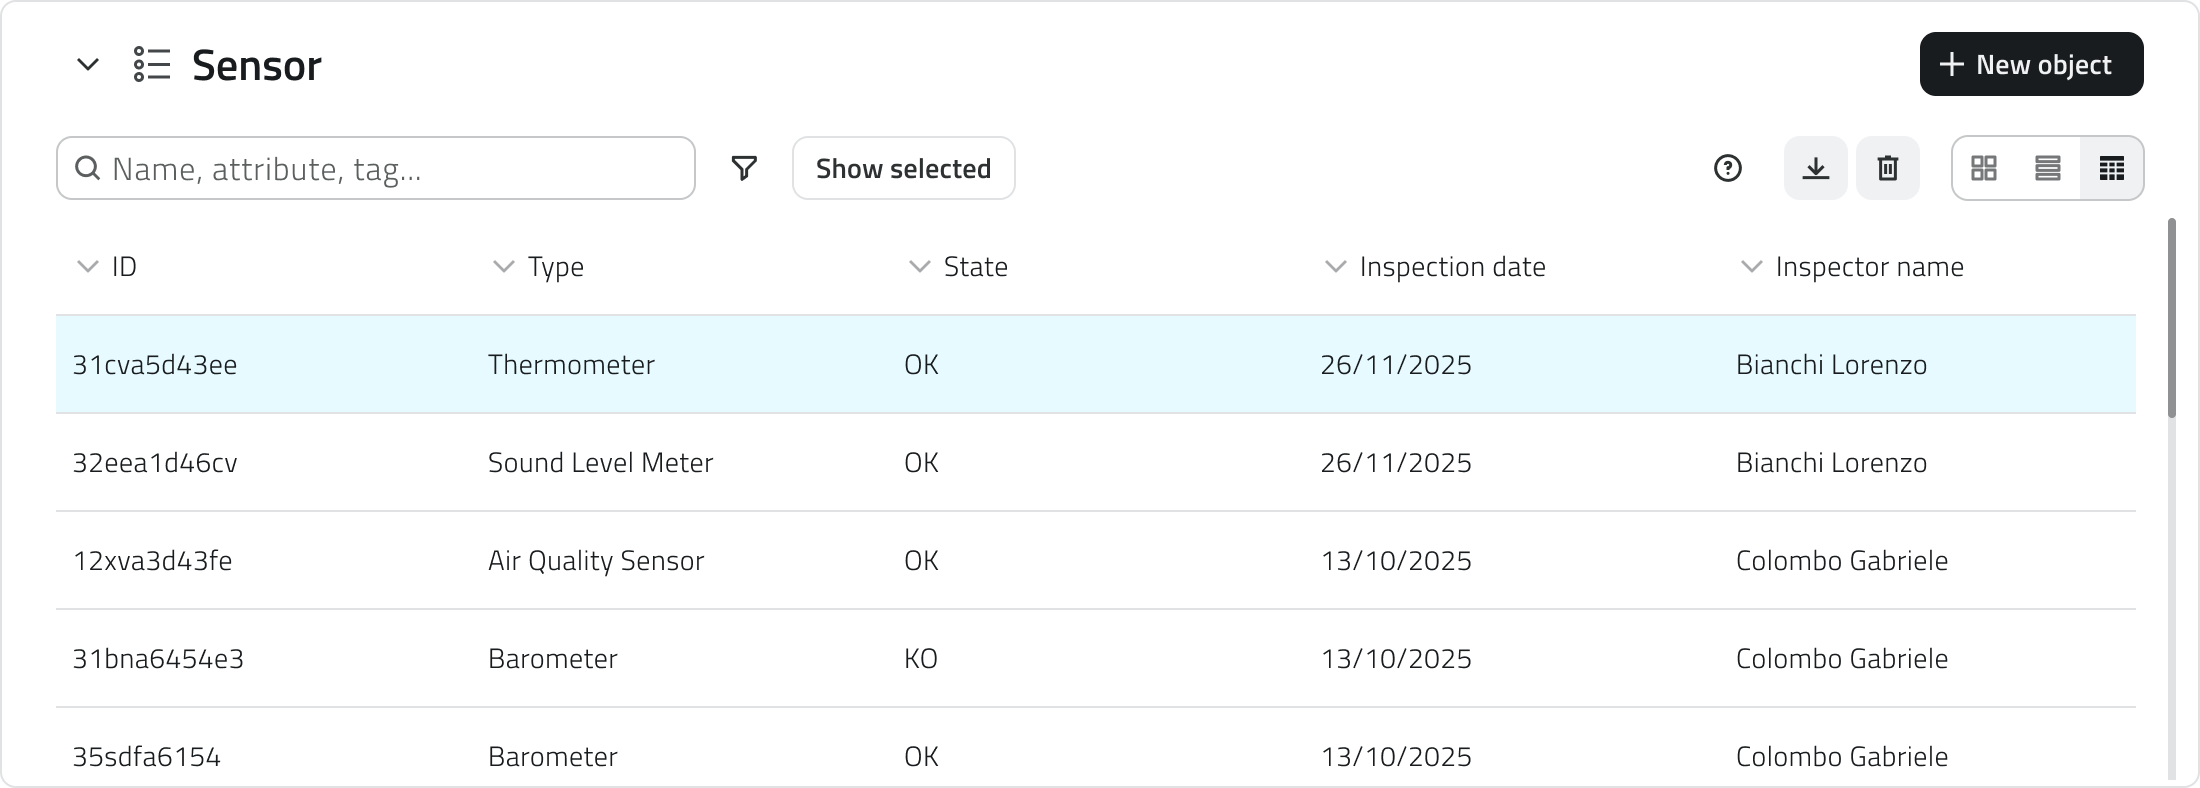
Inventory view
Shows the list of all objects of a specific class. Useful for viewing attributes, searching and comparing data.
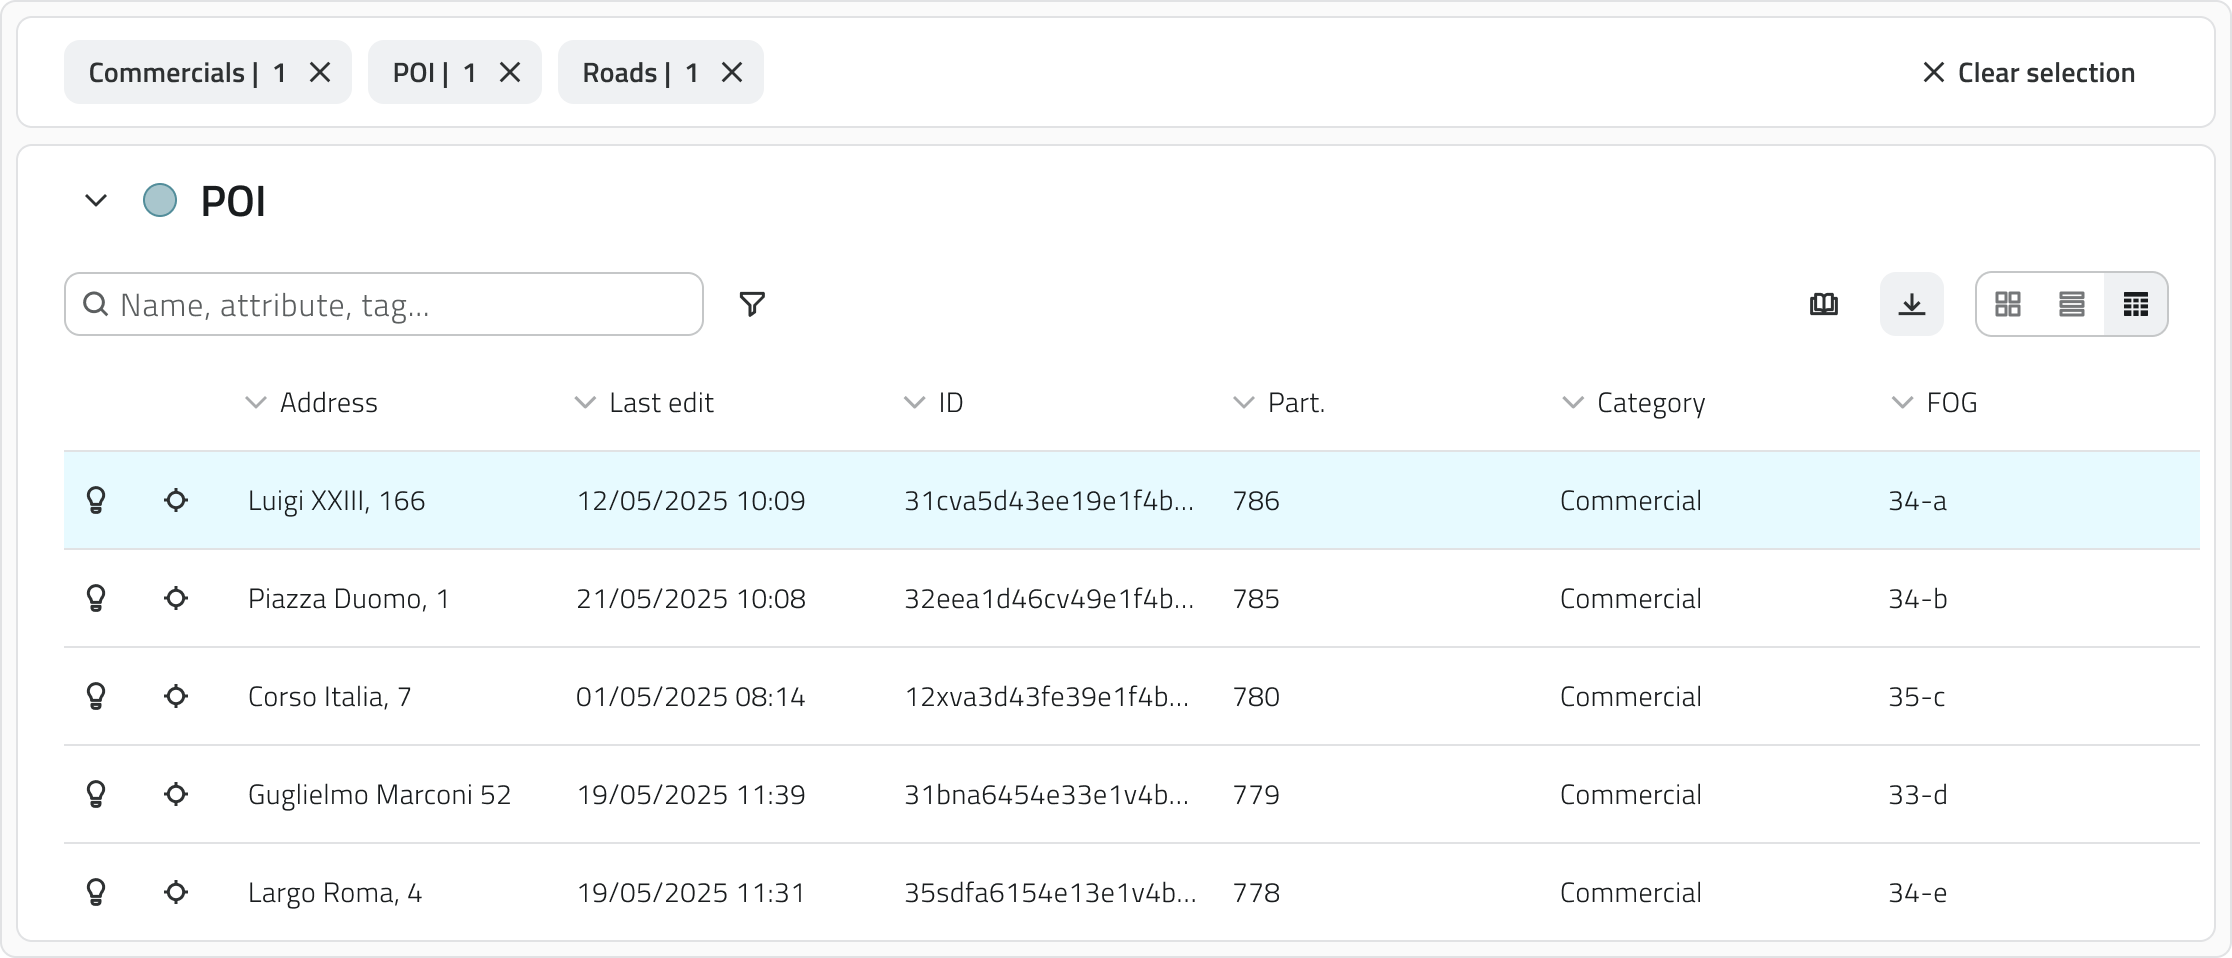
When one or more objects are selected in any view, a selection bar appears above the Inventory view. For each object class involved in the selection, a label appears showing the count of selected elements. Clicking the label opens the Inventory view filtered on that class; clicking X deselects all objects of the corresponding class.
Filtering and sorting
| Tool | Function |
| View | Switch the display mode between card, list or table |
| Search | Search objects by name or attribute using the search bar to filter in real time |
| Filter by selection | To show only the objects currently selected in the project, enable Show selected |
| Sorting | Sort objects by attribute value by clicking the column headers in table view |
Functionality
| Tool | Function |
| New Object | Create an instance of the object class (available only for Form-type classes and with edit permissions) |
| Download | Download a CSV file of the list |
| Delete | Delete the selected objects (available only with edit permissions) |
| Locate | Highlight the object in the 2D and 3D views (available only for vector object classes) |
| Go to | Center the view on the object in the 2D and 3D views (available only for vector object classes) |
Object selection
| Mode | Actions |
| Single object | Click with the left mouse button. |
| Multiple objects (card/list/table) | Hold CTRL and click the desired objects. |
| Multiple objects (table only) | Click an object, hold SHIFT and click another: all elements between the two are selected. |
Opening object details
To open the Attribute details panel for an object, click the blue Open button that appears when hovering over the element.
💡 Tips:
- To quickly compare a larger number of elements, use the table display.
- If you have applied filters or searches, the exported CSV file will only contain the elements currently displayed.
Reports view
Shows the list of all elements generated by a specific report template. Useful for downloading, browsing and analysing the data collected in the project.

Filtering and sorting
| Tool | Function |
| View | Switch the display mode between card, list or table |
| Search | Search reports by name or attribute using the search bar to filter in real time |
| Filter by selection | To show only the reports currently selected in the project, enable Show selected |
| Sorting | Sort reports by attribute value by clicking the column headers in table view |
Functionality
| Tool | Function |
| Download | Downloads the report file; the button is present on every row of the list |
| Download selected reports | Downloads the files of all selected reports |
| Generate report | Generates a new report from the template (requires edit permissions) |
| Delete | Deletes the selected reports (appears only after selecting one or more elements; requires edit permissions) |
Report selection
| Mode | Actions |
| Single object | Click with the left mouse button. |
| Multiple objects (card/list/table) | Hold CTRL and click the desired objects. |
| Multiple objects (table only) | Click an object, hold SHIFT and click another: all elements between the two are selected. |
Report Details
To open the details of a report, click the blue Open button that appears when hovering over the element.
Streaming view
Plays video streams from robots (Mission Units) and connected add-ons. Useful for following missions in real time, recording video and taking photos.
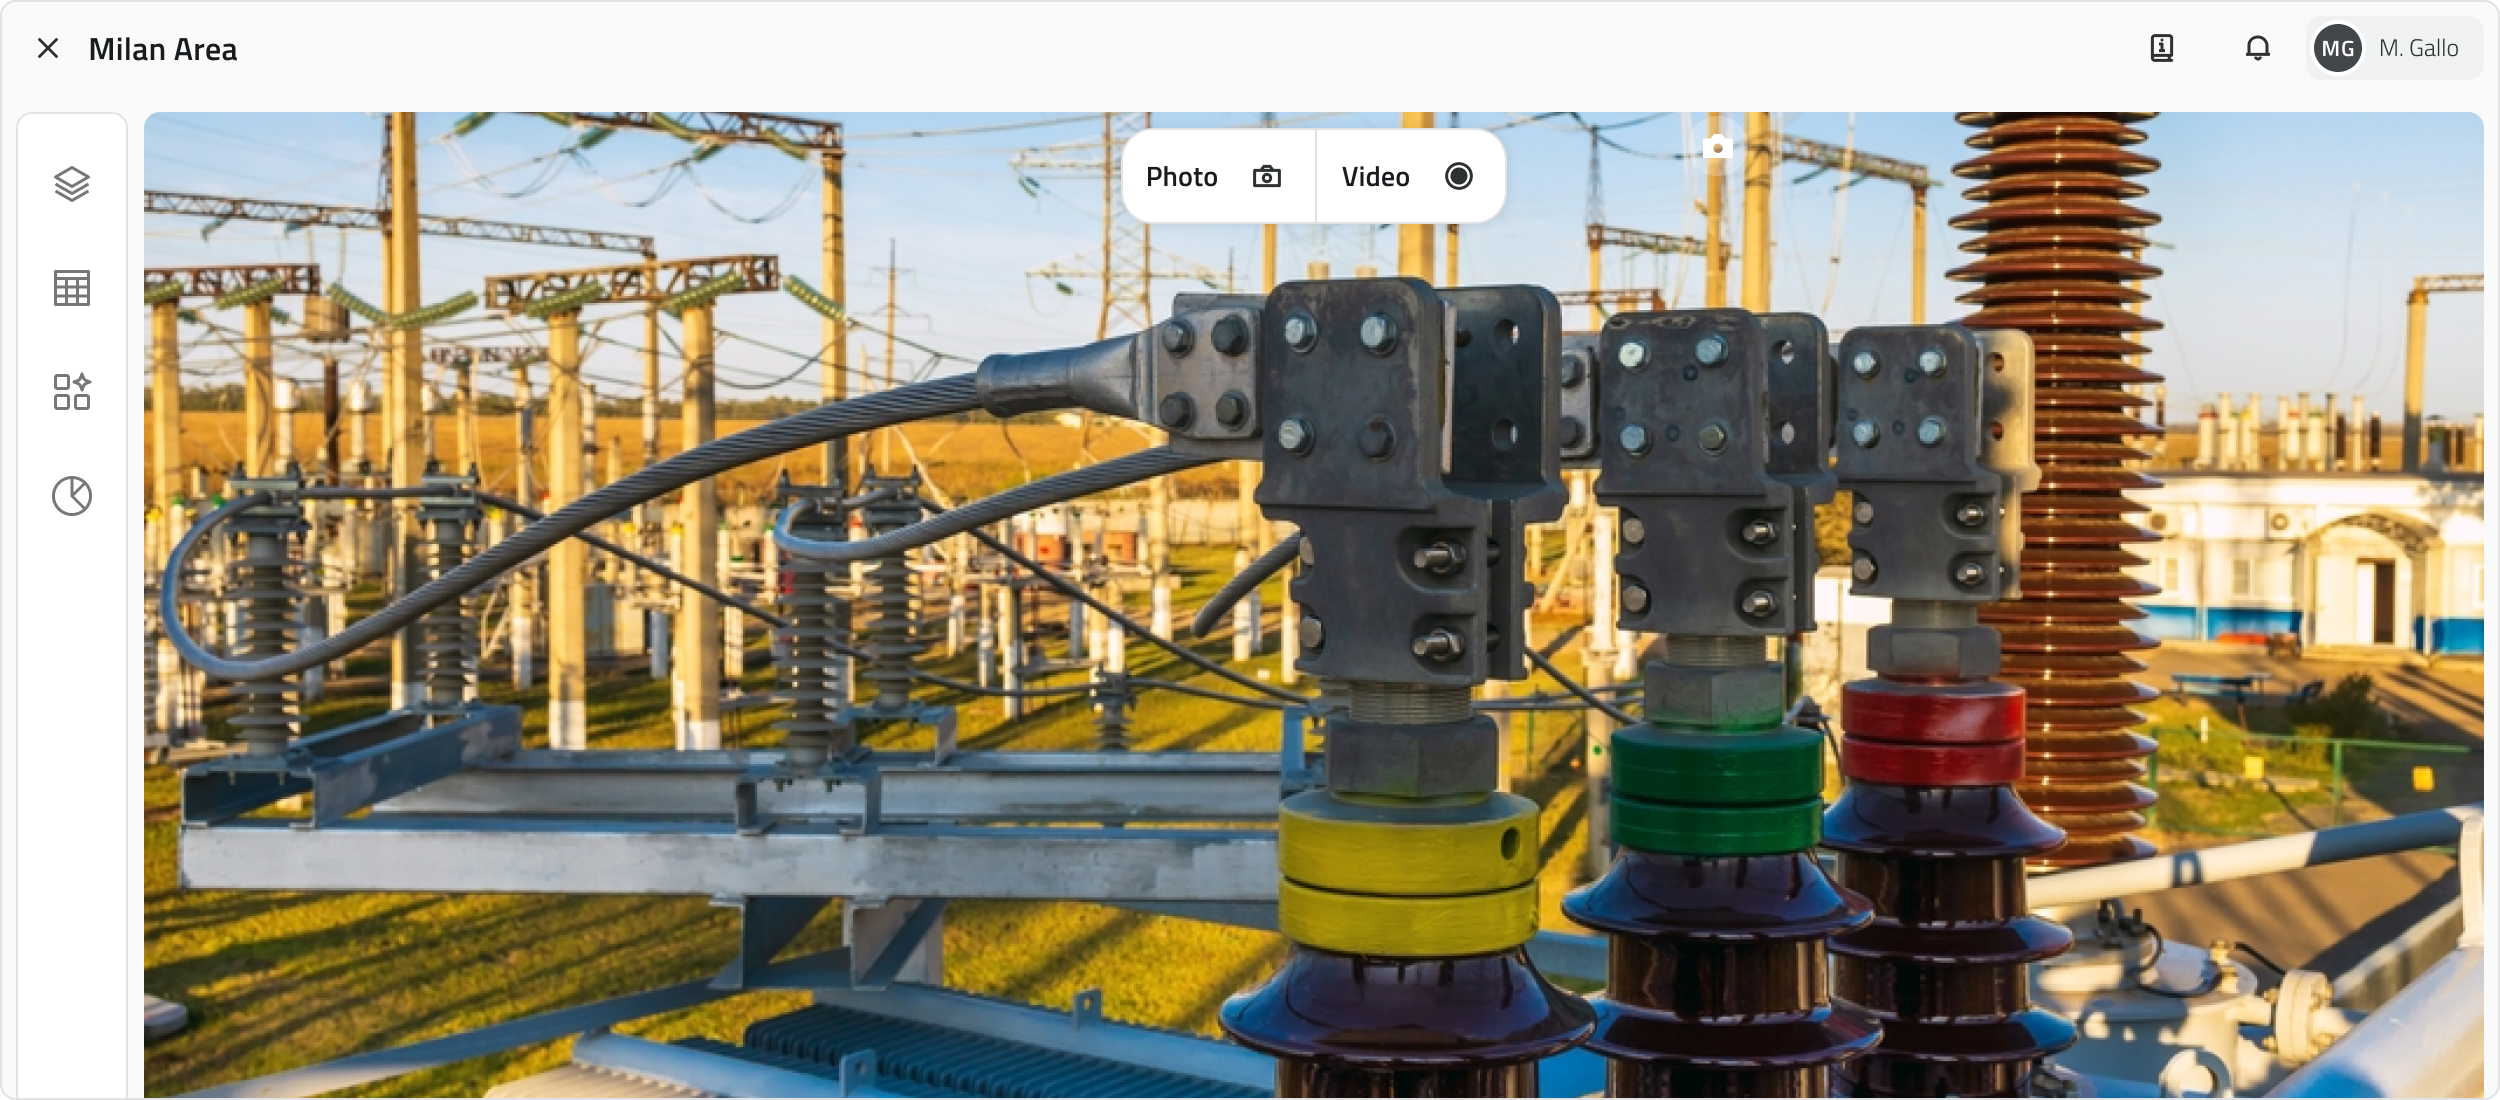
Functionality
| Tool | Function |
| Pause/Resume | Pauses and resumes playback from the same point |
| Streaming time | Shows the duration of the current stream |
| Real Time | Use the progress bar to return to live immediately after a pause |
| Audio | Adjusts the streaming volume |
| Expand | Enables full screen or picture in picture mode |
💡 Tip: To return to live immediately after a pause, drag the progress bar to the end.
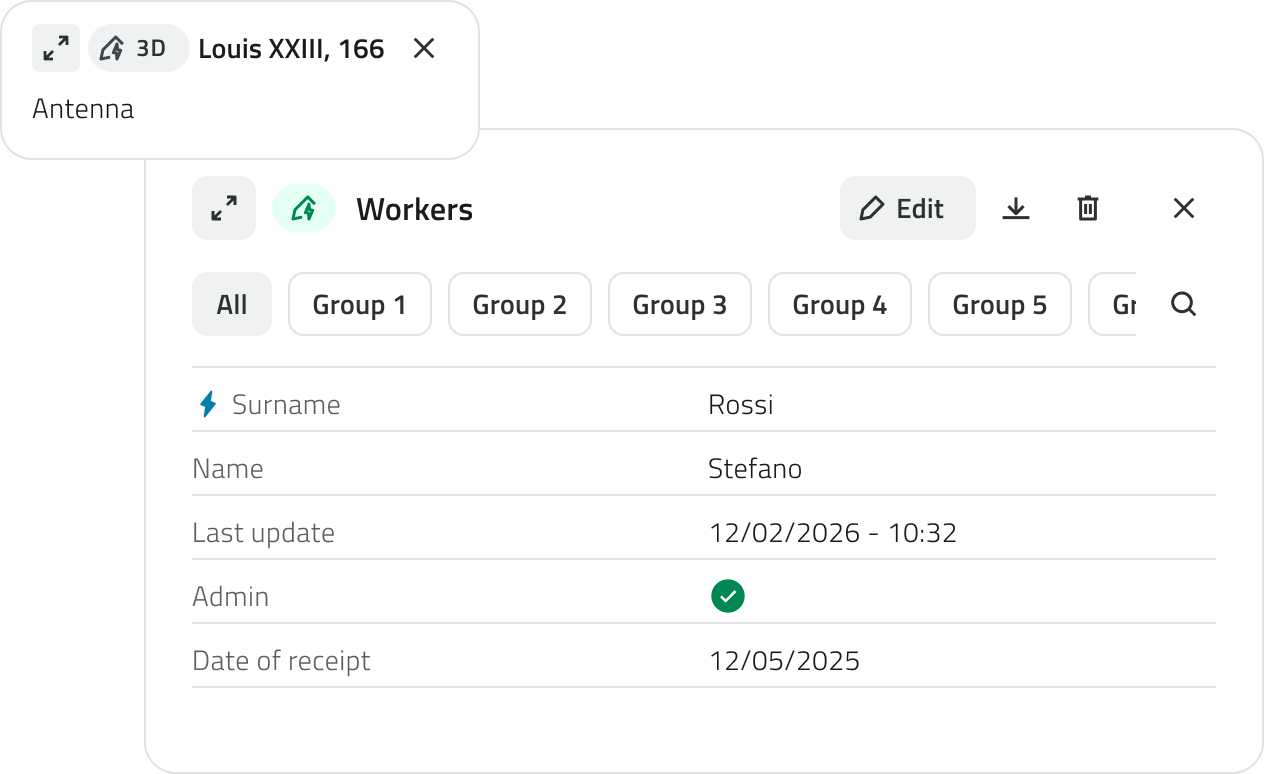
Object Details
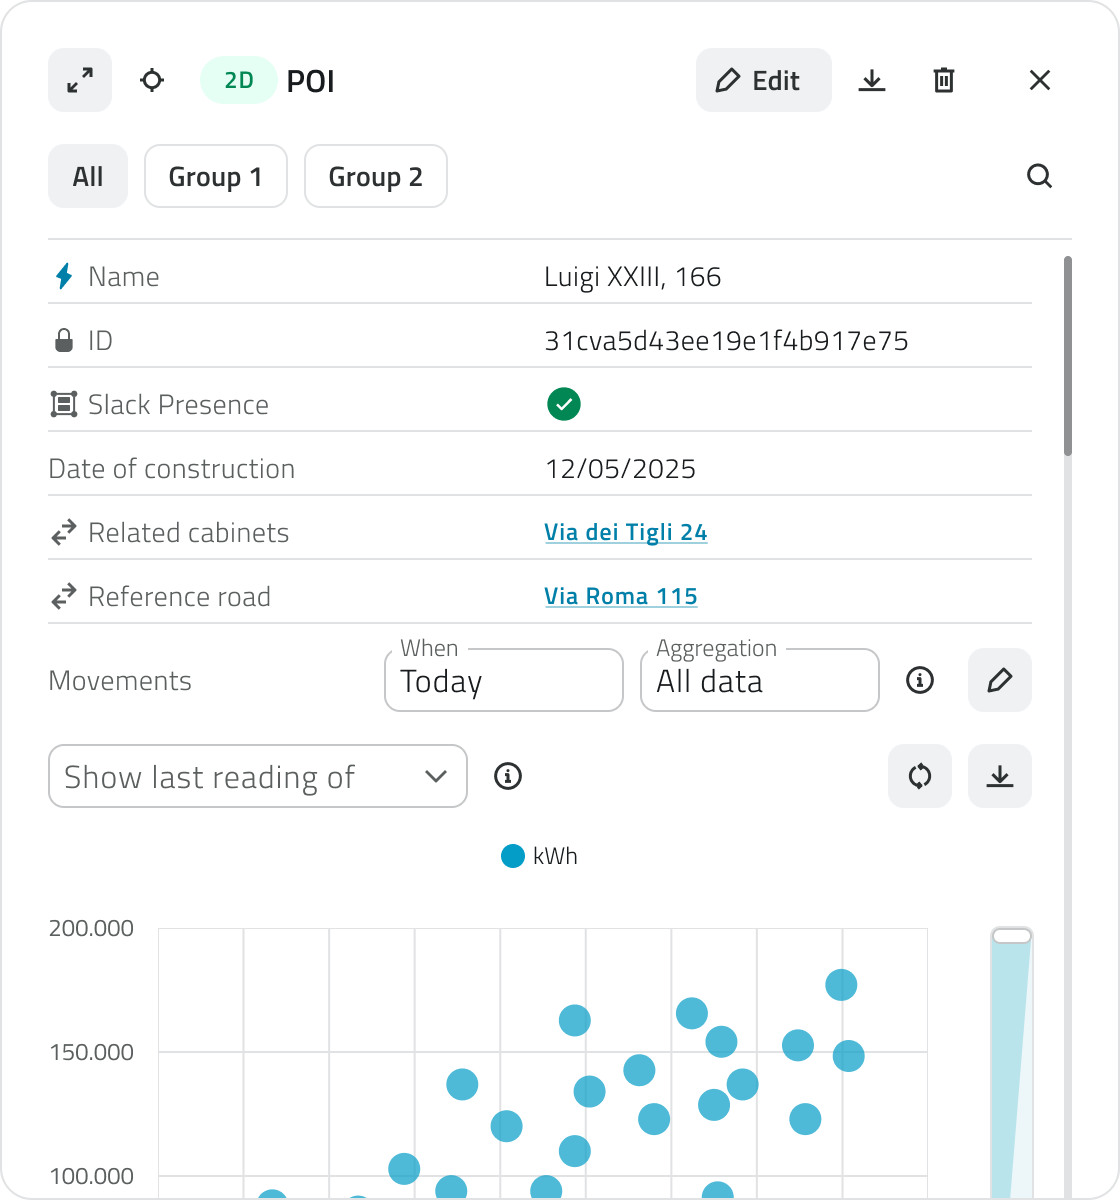
At the top left you will find the Expand button, which brings the panel to full screen, the Locate button, which highlights the object in the 2D and 3D views, and the Go to button, which centres the view on the object. If the object is of vector type, a creation label also appears indicating the view in which it was created (2D or 3D). The label is also present for automatically created objects, both vector and form type. This is followed by the name of the object class the object belongs to.
On the right you will find the Edit button, to update attribute values, the Download button, to export the details as a CSV file, the Delete button, to remove the object from the project, and the Close button, to close the panel.
Edit, create and delete actions are only available if you have edit permissions for that object class.
Below the header there is a search bar to quickly filter attributes by name. Below that is the attribute list: the first is always the main attribute, followed by the others in the configured order.
When the panel is expanded to full screen, attributes are arranged in two columns and, if the object has associated charts, these are displayed in a column on the right.
Functionality
| Tool | Function |
| Expand | Brings the panel to full screen, with attributes in two columns and charts on the right |
| Locate | Highlights the object in the 2D and 3D views |
| Go to | Centres the 2D and 3D view on the object |
| Edit | Edit attribute values (requires edit permissions) |
| Download | Download the details as a CSV file |
| Delete | Removes the object from the project (requires edit permissions) |
| Close | Closes the panel |
Links
- Create and manage Projects
- Managing objects in the project
- Robot Dog - Tracking a live mission
- Drone - Tracking a live mission
![]() Italian version
Italian version
Il progetto offre diverse viste per interagire con gli oggetti e i dati: Mappa 2D, Mappa 3D, Inventory, Report e Streaming.
Apertura e chiusura delle viste
All'avvio del progetto alcune viste si aprono automaticamente. Cliccando sull'icona Layers nella barra laterale sinistra si apre il pannello omonimo, dal quale è possibile attivare o disattivare la visualizzazione delle singole viste e delle classi oggetto tramite l'icona dell'occhio.
Navigazione e visualizzazione degli oggetti
Gli oggetti vettoriali sono visibili sia nella vista 2D che nella vista 3D, indipendentemente da dove vengono creati. In entrambe le viste gli oggetti sono georeferenziati e mantengono la stessa posizione geografica all'interno dello spazio di lavoro. Gli oggetti visualizzati nella mappa 2D sono rappresentati come elementi piatti su un piano, mentre nella vista 3D sono collocati nello spazio tridimensionale.
Alcuni oggetti creati in modo automatico potrebbero essere visibili solo nella vista 2D.
Puoi localizzare rapidamente una posizione nella mappa 2D passando con il mouse sopra la vista: comparirà la barra degli strumenti, dalla quale puoi cliccare il pulsante Cerca (icona della lente di ingrandimento).
Si aprirà una barra di ricerca in cui puoi digitare un indirizzo o il nome di una città. Durante la digitazione il sistema mostra automaticamente i risultati suggeriti.
Seleziona uno dei risultati proposti per centrare la mappa sulla posizione scelta.
Vista GIS 2D
Mostra la mappa georeferenziata del progetto e degli oggetti.
Utile per l'esplorazione territoriale e la verifica della posizione degli asset.
L'indicatore di posizione, visibile in blu nella mappa 2D, mostra il punto in cui è orientata la camera nella vista 3D.
Navigazione
| Azione | Controllo |
| Zoom in/out | Rotellina del mouse / Bottoni + e - in basso a destra |
| Spostamento | Tieni premuto il tasto sinistro/la rotellina del mouse e trascina |
| Sposta vista 3D |
Pulsante Sposta Vista 3D |
| Mappa di base | Selettore in basso a sinistra (satellitare, stradale, ecc.) |
| Nascondi vista | Pulsante con icona occhio in basso a destra |
Barra degli strumenti
Passando con il mouse sopra la vista 2D compare la barra degli strumenti nella parte alta della vista. Gli strumenti disponibili sono:
| Strumento | Funzione |
| Disegna | Seleziona la classe oggetto desiderata per disegnare un nuovo oggetto |
| Misura | Scegli il tipo di misura per misurare distanze o aree |
| Seleziona | Scegli la modalità di selezione per selezionare uno o più oggetti |
| Sposta vista 3D | Posiziona l'indicatore di posizione nel punto desiderato per spostare la telecamera 3D |
| Cerca | Cerca un indirizzo o una città per centrare la mappa sulla posizione |
Selezione degli oggetti
Utilizza lo strumento Seleziona (attivo di default in modalità Cursore all'apertura). Clicca la freccia accanto al pulsante Seleziona per accedere alle modalità.
| Modalità | Azioni |
| Cursore | Clicca con il tasto sinistro per selezionare un singolo oggetto. Tieni premuto SHIFT e clicca per aggiungere o rimuovere oggetti dalla selezione. Clicca con il tasto destro per gestire gli oggetti sovrapposti: se presenti, si apre una finestra che li elenca tutti. |
| Bounding Box | Clicca e trascina con il tasto sinistro per selezionare tutti gli oggetti compresi nel rettangolo disegnato. |
| Poligono | Clicca con il tasto sinistro per inserire i vertici del poligono. Clicca con il tasto destro per chiuderlo e selezionare tutti gli oggetti al suo interno. |
| Poligono esistente | Clicca con il tasto sinistro su un poligono già presente in mappa per selezionarlo insieme a tutti gli oggetti contenuti al suo interno. |
Aprire i dettagli di un oggetto
Per aprire il Dettaglio attributi di un oggetto, selezionalo sulla mappa: comparirà un'info card con la classe oggetto, l'attributo principale e un'etichetta che indica la vista di creazione. Clicca il pulsante Espandi (icona con due frecce) per aprire il pannello completo.
Vista 3D
Permette di navigare in un ambiente tridimensionale, visualizzando nuvole di punti, mesh e foto 360°.
Navigazione
| Azione | Controllo |
| Rotazione visuale | Tieni premuto il tasto sinistro del mouse e trascina |
| Zoom in/out | Rotellina del mouse |
| Movimento (Avanti/Indietro/Sinistra/Destra) | Tasti W A S D |
| Movimento (Su/Giù) | Frecce della tastiera |
| Spostamento Trasversale (Pan) | Tieni premuto il tasto destro/la rotellina del mouse e trascina |
| Nascondi vista | Pulsante con icona occhio in basso a destra |
💡 Suggerimento: nella navigazione 3D combina mouse e tastiera per spostarti con più precisione.
Barra degli strumenti
Passando con il mouse sopra la vista 3D compare la barra degli strumenti nella parte alta della vista. Gli strumenti disponibili sono:
| Strumento | Funzione |
| Disegna | Seleziona la classe oggetto desiderata per disegnare un nuovo oggetto |
| Misura | Scegli il tipo di misura per misurare distanze o aree |
| Esporta nuvola di punti | Seleziona una sezione della nuvola di punti ed esportala |
| Stile | Modifica lo stile di visualizzazione della scena |
| Impostazioni | Modifica la velocità di navigazione nella vista 3D |
| Seleziona | Scegli la modalità di selezione per selezionare uno o più oggetti |
Gli strumenti Stile e Impostazioni sono utili per personalizzare la Vista 3D.
Selezione degli oggetti
Utilizza lo strumento Seleziona (attivo di default all'apertura).
| Modalità | Azioni |
| Cursore | Clicca con il tasto sinistro per selezionare un singolo oggetto. Tieni premuto SHIFT e clicca per aggiungere o rimuovere oggetti dalla selezione. |
Aprire i dettagli di un oggetto
Per aprire il Dettaglio attributi di un oggetto, selezionalo sulla mappa: comparirà un'info card con la classe oggetto, l'attributo principale e un'etichetta che indica la vista di creazione. Clicca il pulsante Espandi (icona con due frecce) per aprire il pannello completo.
Vista Inventory
Mostra l’elenco di tutti gli oggetti di una specifica classe. Utile per visualizzare attributi, cercare e confrontare dati.
Selezionando uno o più oggetti, in qualsiasi vista, compare una barra di selezione sopra la vista Inventory. Per ogni classe oggetto coinvolta nella selezione appare un'etichetta con il conteggio degli elementi selezionati. Cliccando sull'etichetta si apre la vista Inventory filtrata su quella classe; cliccando la X si deselezionano tutti gli oggetti della classe corrispondente.
Filtro e ordinamento
| Strumento | Funzione |
| Visualizzazione | Cambia la modalità di visualizzazione in card, lista o tabella |
| Ricerca | Cerca oggetti per nome o attributo tramite la barra di ricerca per filtrare in tempo reale |
| Filtra per selezione | Per visualizzare solo gli oggetti selezionati attivamente nel progetto, attiva Mostra selezionati |
| Ordinamento | Ordina gli oggetti in base al valore dell'attributo cliccando sulle intestazioni di colonna nella vista a tabella |
Funzionalità
| Strumento | Funzione |
| Nuovo oggetto | Crea un'istanza per la classe oggetto (disponibile solo per le classi di tipo Form e con permessi di modifica) |
| Download | Scarica un file CSV dell'elenco |
| Elimina | Elimina gli oggetti selezionati (disponibile solo con permessi di modifica) |
| Individua | Evidenzia l'oggetto nelle viste 2D e 3D (disponibile solo per le classi oggetto vettoriali) |
| Vai a | Centra la visuale sull'oggetto nelle viste 2D e 3D (disponibile solo per le classi oggetto vettoriali) |
Selezione degli oggetti
| Modalità | Azioni |
| Singolo oggetto | Clicca il tasto sinistro del mouse. |
| Oggetti multipli (card/lista/tabella) | Tieni premuto CTRL e clicca sugli oggetti desiderati. |
| Oggetti multipli (solo tabella) | Clicca su un oggetto, tieni premuto SHIFT e clicca su un altro: vengono selezionati tutti gli elementi compresi tra i due. |
Aprire i dettagli di un oggetto
Per aprire il Dettaglio attributi di un oggetto, clicca il pulsante blu Apri che compare al passaggio del mouse sull'elemento.
💡 Suggerimenti:
- Se vuoi confrontare rapidamente un maggior numero di elementi usa la visualizzazione a tabella.
- Se hai applicato filtri o ricerche, il file CSV esportato conterrà soltanto gli elementi attualmente visualizzati.
Vista Report
Mostra l'elenco di tutti gli elementi generati da uno specifico template di report. Utile per scaricare, consultare e analizzare i dati raccolti nel progetto.
Filtro e ordinamento
| Strumento | Funzione |
| Visualizzazione | Cambia la modalità di visualizzazione in card, lista o tabella |
| Ricerca | Cerca report per nome o attributo tramite la barra di ricerca per filtrare in tempo reale |
| Filtra per selezione | Per visualizzare solo i report selezionati attivamente nel progetto, attiva Mostra selezionati |
| Ordinamento | Ordina i report in base al valore dell'attributo cliccando sulle intestazioni di colonna nella vista a tabella |
Funzionalità
| Strumento | Funzione |
| Download | Scarica il file del report; il pulsante è presente su ogni riga dell'elenco |
| Download report selezionati | Scarica i file di tutti i report selezionati |
| Genera report | Genera un nuovo report dal template (richiede permessi di modifica) |
| Elimina | Elimina i report selezionati (compare solo dopo aver selezionato uno o più elementi; richiede permessi di modifica) |
Selezione dei report
| Modalità | Azioni |
| Singolo oggetto | Clicca il tasto sinistro del mouse. |
| Oggetti multipli (card/lista/tabella) | Tieni premuto CTRL e clicca sugli oggetti desiderati. |
| Oggetti multipli (solo tabella) | Clicca su un oggetto, tieni premuto SHIFT e clicca su un altro: vengono selezionati tutti gli elementi compresi tra i due. |
Dettagli dei report
Per aprire i dettagli di un report, clicca il pulsante blu Apri che compare al passaggio del mouse sull'elemento.
Vista Streaming
Riproduce flussi video da robot (Mission Units) e add-on connessi. Utile per seguire missioni in tempo reale, registrare video e scattare foto.
Funzionalità
| Strumento | Funzione |
| Pausa/Riprendi | Mette in pausa e riprende la riproduzione dallo stesso punto |
| Tempo di Streaming | Mostra la durata dello streaming in corso |
| Real Time | Usa la barra di avanzamento per tornare subito al live dopo una pausa |
| Audio | Regola il volume dello streaming |
| Espansione | Attiva la modalità a schermo intero o picture in picture |
💡 Suggerimento: Per tornare subito al live dopo una pausa, porta la barra di avanzamento fino alla fine.
Dettagli di un Oggetto
In alto a sinistra si trovano il pulsante Espandi, che porta il pannello a schermo intero, il pulsante Individua, che evidenzia l'oggetto nelle viste 2D e 3D, e il pulsante Vai a, che centra la visuale sull'oggetto. Se l'oggetto è di tipo vettoriale, compare inoltre un'etichetta di creazione che indica la vista in cui è stato creato (2D o 3D). L'etichetta è presente anche per gli oggetti creati automaticamente, sia vettoriali che di tipo form. Segue il nome della classe oggetto a cui appartiene l'oggetto.
Sulla destra si trovano il pulsante Modifica, per aggiornare i valori degli attributi, il pulsante Download, per esportare i dettagli in formato CSV, il pulsante Elimina, per rimuovere l'oggetto dal progetto, e il pulsante Chiudi, per chiudere il pannello.
Le azioni di modifica, creazione ed eliminazione sono disponibili solo se si dispone dei permessi di modifica per quella classe oggetto.
Sotto l'intestazione è presente una barra di ricerca per filtrare rapidamente gli attributi per nome. Al di sotto si trova l'elenco degli attributi: il primo è sempre l'attributo principale, seguito dagli altri nell'ordine configurato.
Espandendo il pannello a schermo intero, gli attributi vengono distribuiti su due colonne e, se l'oggetto ha grafici associati, questi vengono visualizzati in una colonna sulla destra.
Funzionalità
| Strumento | Funzione |
| Espandi | Porta il pannello a schermo intero, con attributi su due colonne e grafici a destra |
| Individua | Evidenzia l'oggetto nelle viste 2D e 3D |
| Vai a | Centra la visuale del 2D e 3D sull'oggetto |
| Modifica | Modifica i valori degli attributi (richiede permessi di modifica) |
| Download | Scarica i dettagli in formato CSV |
| Elimina | Elimina l'oggetto dal progetto (richiede permessi di modifica) |
| Chiudi | Chiude il pannello |
Collegamenti
- Creare e gestire i Progetti
- Gestire gli oggetti nel progetto
- Robot Dog - Monitorare una missione live
- Drone - Monitorare una missione live
Last update: 20 May 2026
Using panels
![]() English version
English version
This section provides guidance on the use and functionality of the main project management and analysis panels.
Layers Panel
The Layers Panel (icon with three overlapping panels) allows you to manage the visibility, locking, labels and snap of the object classes and resources in the project.
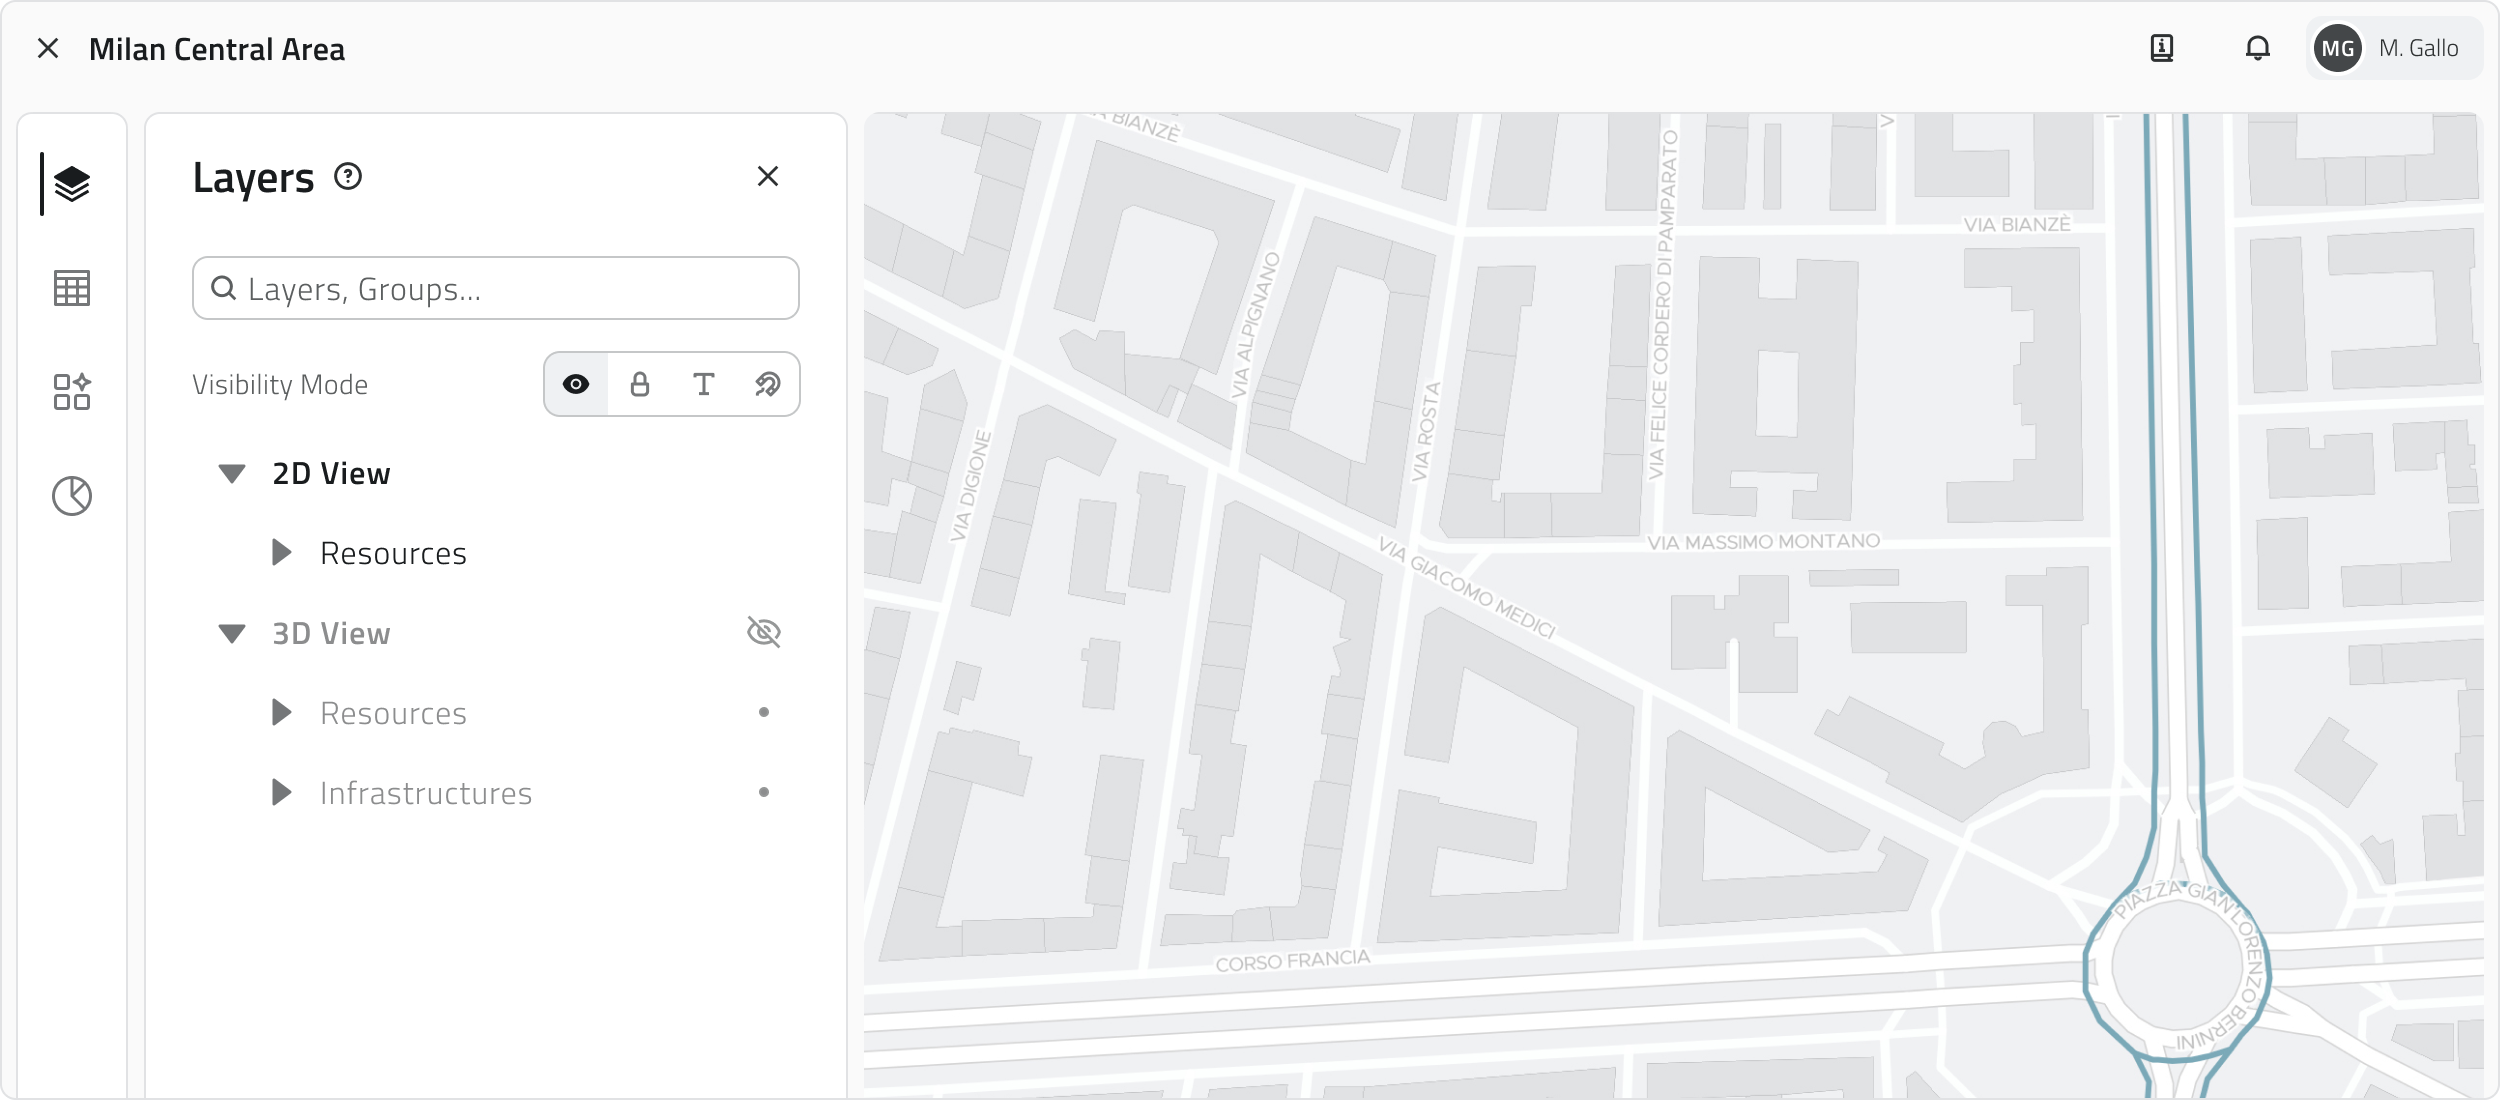
Interaction modes
To switch between modes, click the icons in the selector next to the name of the mode you are in. The available modes are:
| Mode | Function | Interaction | Note |
| Visibility | Show or hide instances in the 2D and 3D views. | Click the eye icon next to the name of the Object Class. | Visibility is separate between 2D and 3D. |
| Lock | Prevent interactions on instances in the 2D and 3D views, instances remain visible. | Click the lock icon next to the name of the Object Class. | All layers are unlocked by default. |
| Label | Show a label above each instance in the 2D and 3D views. | Click the text icon next to the name of the Object Class. | Disabled by default. |
| Snap | Disable automatic snap on instances in the 2D and 3D views. | Click the magnet icon next to the name of the Object Class. | Snap is active by default on all classes. |
💡 Tips:
- Enable locking on layers that should not be modified to avoid unwanted selections or interactions.
- Enable labels only for the classes you want to identify quickly, to avoid overloading the map.
- If snap interferes with drawing geometries or taking measurements, disable it on classes with many objects.
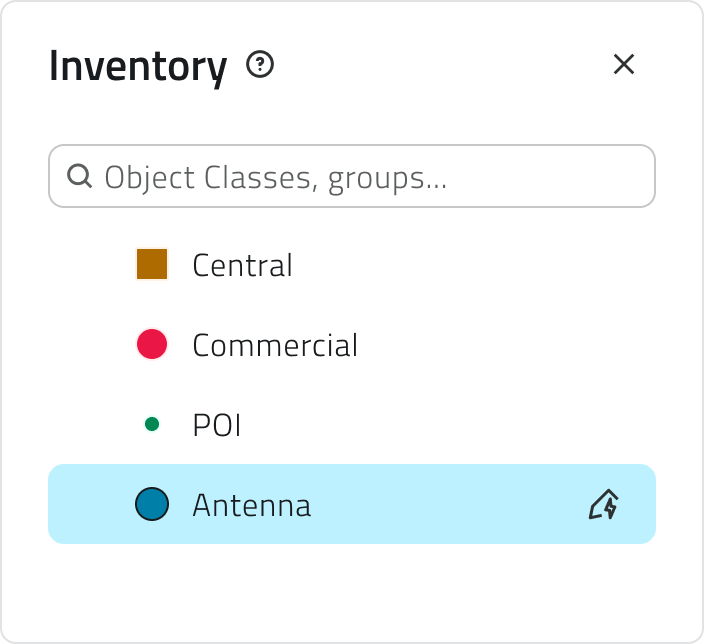
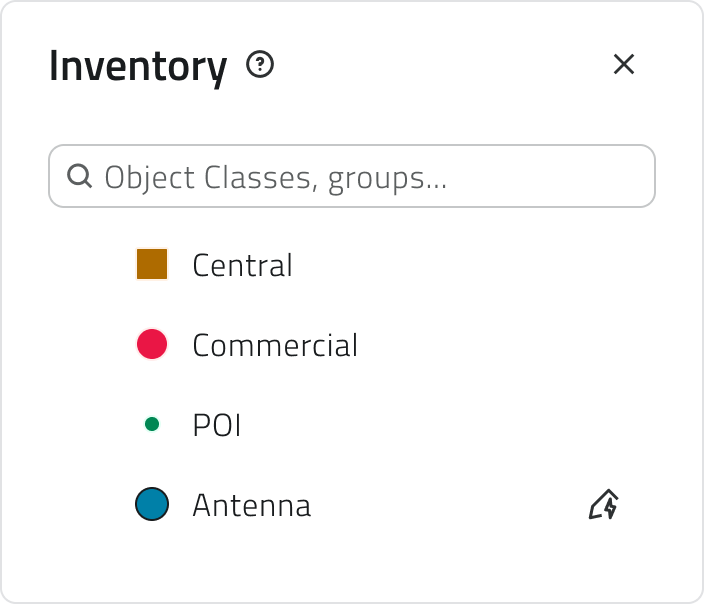
Inventory Panel
The Inventory Panel (table-shaped icon) is the dedicated tool for managing and browsing the object classes in the project.
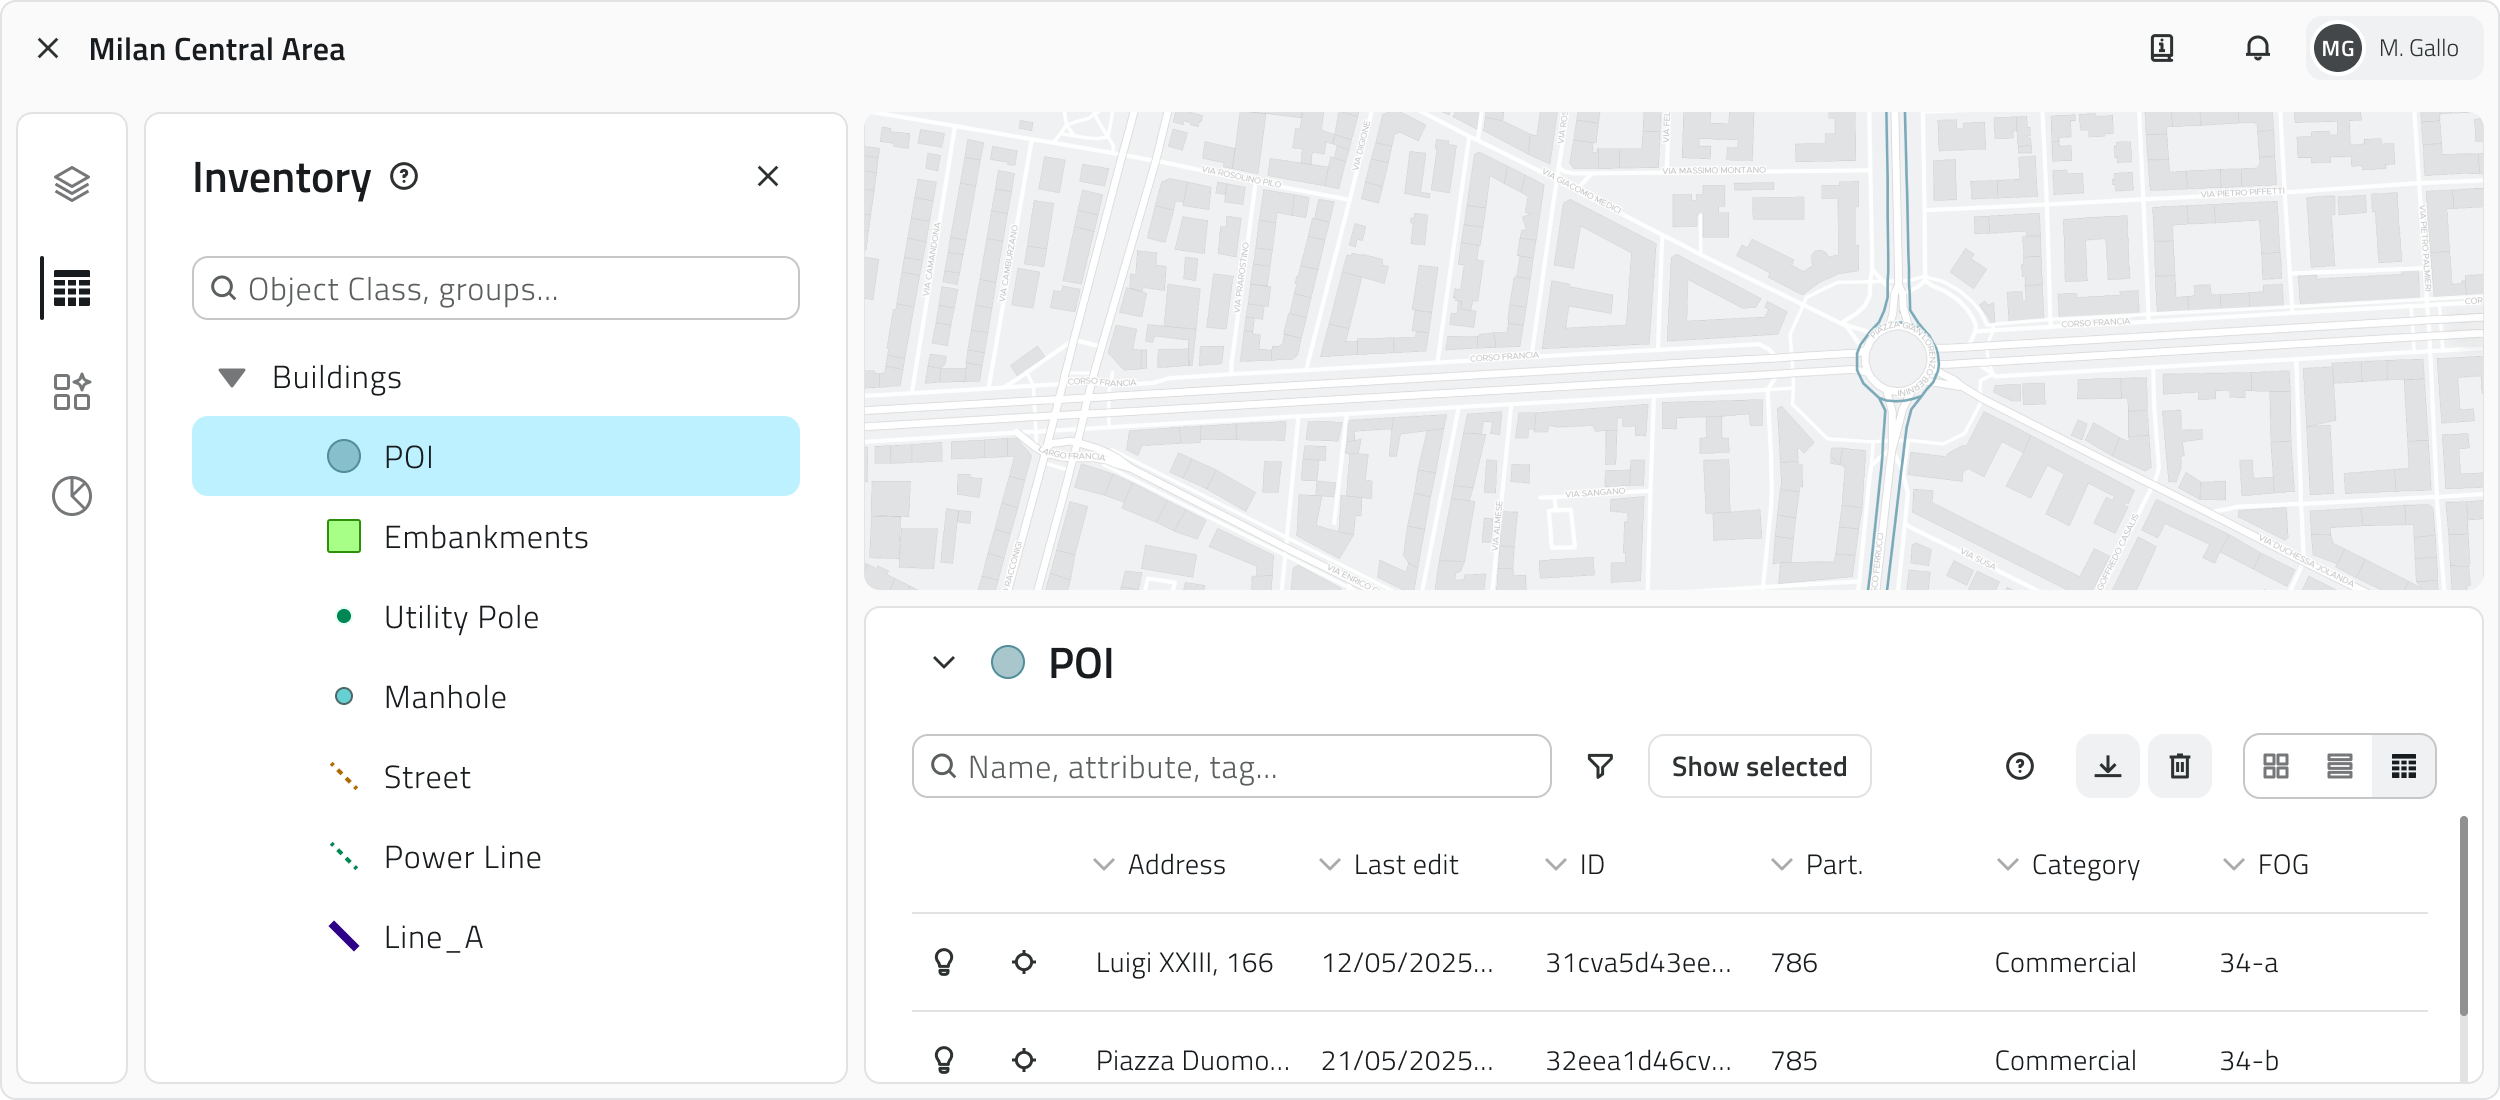
Clicking on the name of an object class in the list opens the corresponding Inventory view. Next to each class name, the style applied to the objects on the map is shown, useful for identifying them more easily. For Form type classes, which have no geometry on the map, the Form icon appears instead: these classes can only be accessed and browsed from the Inventory panel. For classes that have the automatic object creation function enabled, the corresponding icon is shown at the end of the row.
To quickly filter object classes without scrolling through the full list, use the search bar at the top of the panel.
Dashboard Panel
Available only with sensors configured in advance.
The Dashboard Panel (pie chart icon) allows you to view the charts associated with selected objects and is the dedicated tool for data analysis.
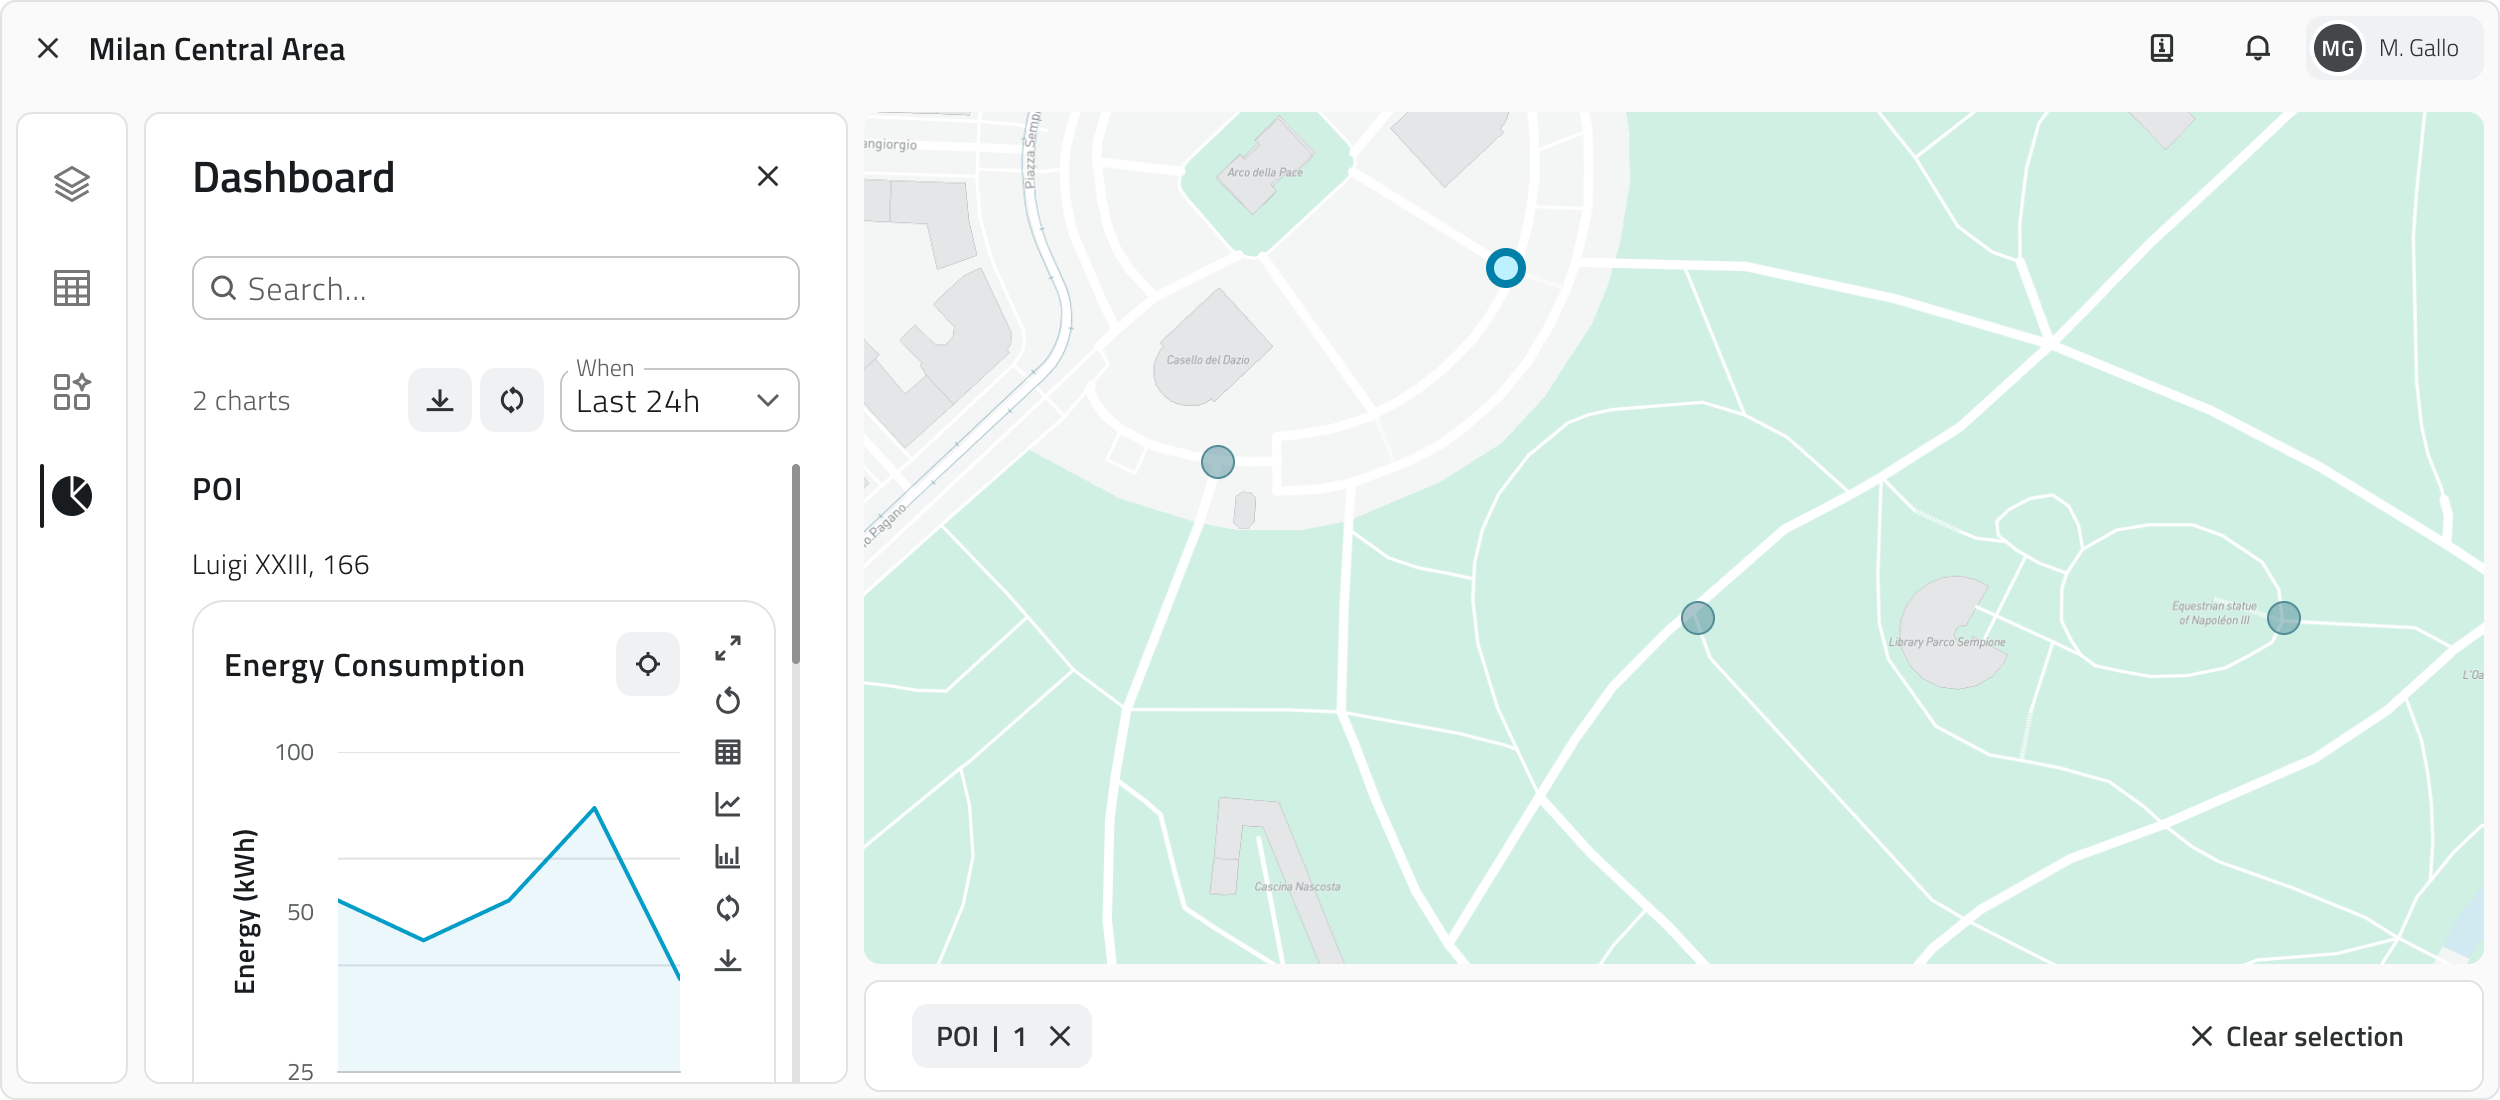
When no objects are selected, the panel is empty. It populates when one or more objects are selected from the 2D, 3D or Inventory view, provided they have chart-type attributes.
The charts are displayed in a column and grouped by object: above each group the main attribute of the object appears, followed by the charts associated with it. The process repeats for each selected object.
💡 Tip: By selecting multiple objects at once you can compare the charts of various objects.
Report Panel
The Report Panel (document-shaped icon) is the dedicated tool for browsing the reports configured for the project.
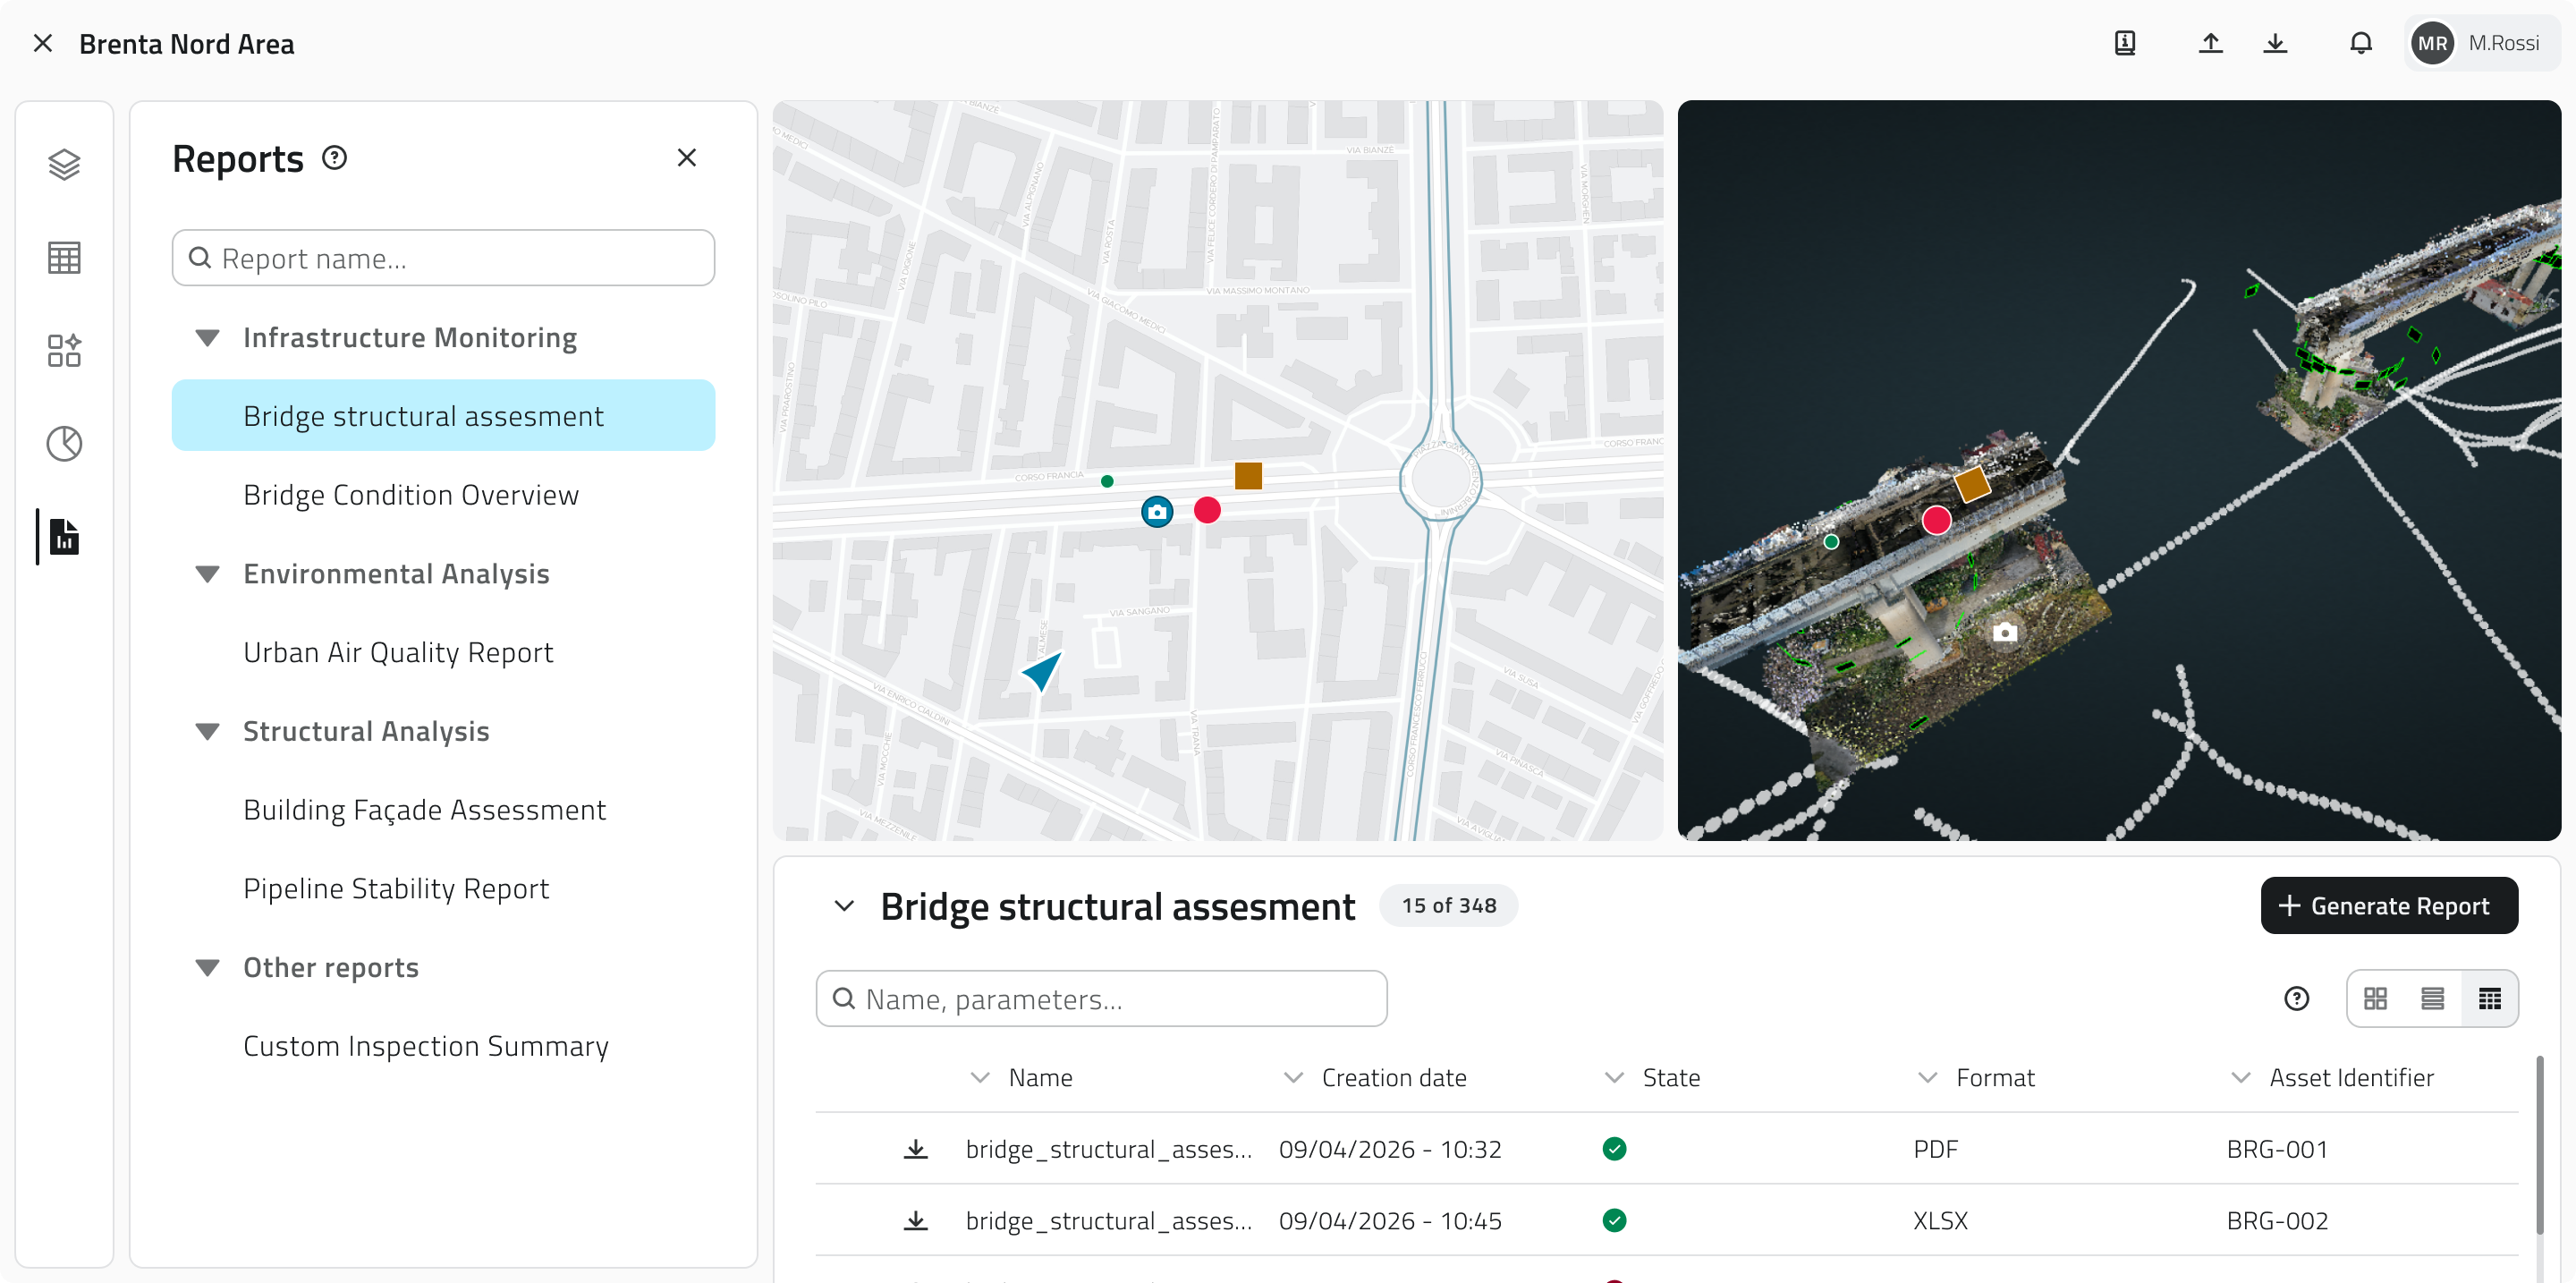
Clicking on the name of a report in the list opens the corresponding Report view. The available reports are grouped by category, making it easier to find the one of interest.
To quickly filter reports without scrolling through the full list, use the search bar at the top of the panel.
Links
![]() Italian version
Italian version
Questa sezione fornisce indicazioni sull'utilizzo e le funzionalità dei principali pannelli di gestione e analisi del progetto.
Pannello Layers
Il Pannello Layers (icona con tre pannelli sovrapposti) permette di gestire la visibilità, il blocco, le etichette e lo snap delle classi oggetto e delle risorse presenti nel progetto.
Modalità di interazione
Per passare da una modalità all'altra clicca sulle icone nel selettore, accanto al nome della modalità in cui ti trovi. Le modalità disponibili sono:
| Modalità | Funzione | Interazione | Nota |
| Visualizzazione | Mostrare o nascondere istanze nelle viste 2D e 3D. | Clicca sull'icona dell'occhio accanto al nome della Classe Oggetto. | La visibilità è separata tra 2D e 3D. |
| Blocco | Impedire interazioni sulle istanze nelle viste 2D e 3D, le istanze restano visibili. | Clicca sull'icona del lucchetto accanto al nome della Classe Oggetto. | Tutti i livelli sono sbloccati di default. |
| Etichetta | Mostrare un’etichetta sopra ogni istanza nelle viste 2D e 3D. | Clicca sull'icona del testo accanto al nome della Classe Oggetto. | Disattivate di default. |
| Snap | Disattivare lo snap automatico sulle istanze nelle viste 2D e 3D. | Clicca sull'icona della calamita accanto al nome della Classe Oggetto. | Lo snap è attivo di default su tutte le classi. |
💡 Suggerimenti:
- Attiva il blocco sui livelli che non devono essere modificati per evitare selezioni o interazioni non volute.
- Abilita le etichette solo per le classi che ti interessa identificare rapidamente, per non sovraccaricare la mappa.
- Se lo snap interferisce con il disegno delle geometrie o con le misure, disattivalo sulle classi con molti oggetti.
Pannello Inventory
Il Pannello Inventory (icona a forma di tabella) è lo strumento dedicato alla gestione e consultazione delle classi oggetto presenti nel progetto.
Cliccando sul nome di una classe oggetto nella lista si apre la relativa vista Inventory. Accanto al nome di ciascuna classe è mostrato lo stile applicato agli oggetti in mappa, utile per riconoscerli più facilmente. Per le classi di tipo Form, prive di geometria in mappa, compare invece l'icona Form: queste classi sono accessibili e consultabili solo dal pannello Inventory. Per le classi che hanno la funzione di creazione automatica degli oggetti attiva, è presente a fine riga l'icona corrispondente.
Per filtrare rapidamente le classi oggetto senza scorrere la lista completa, usa la barra di ricerca in cima al pannello.
Pannello Dashboard
Disponibile solo con sensori configurati in precedenza.
Il Pannello Dashboard (icona a forma di grafico a torta) permette di visualizzare i grafici associati agli oggetti selezionati ed è lo strumento dedicato all'analisi dei dati.
Quando non ci sono oggetti selezionati il pannello è vuoto. Si popola selezionando uno o più oggetti dalla vista 2D, 3D o Inventory, a condizione che abbiano attributi di tipo grafico.
I grafici vengono presentati incolonnati e raggruppati per oggetto: sopra ogni gruppo compare l'attributo principale dell'oggetto, seguito dai grafici a esso associati. Il processo si ripete per ciascun oggetto selezionato.
💡 Suggerimento: Selezionando più oggetti contemporaneamente puoi confrontare i grafici di vari oggetti.
Pannello Report
Il Pannello Report (icona a forma di documento) è lo strumento dedicato alla consultazione dei report configurati per il progetto.
Cliccando sul nome di un report nella lista si apre la relativa vista Report. I report disponibili sono raggruppati per categoria, rendendo più semplice individuare quello di interesse.
Per filtrare rapidamente i report senza scorrere la lista completa, usa la barra di ricerca in cima al pannello.
Collegamenti
Last update: 21 May 2026
Managing objects in the project
![]() English version
English version
This section explains how to create objects within the project. Objects can be vector geometries, such as points, lines or polygons, or non-vector objects, known as forms.
Object types
In the project you can create different types of objects:
- Points
Single elements that can be placed in the 2D and 3D views, such as sensors or markers. - Lines
Sequences of connected points forming paths, such as infrastructure routes. - Polygons
Areas delimited by multiple vertices, such as work zones or perimeters. - Forms
Non-vector objects, without geometry, used to enter data through attributes, such as information forms.
Any data entered in the platform is managed on an on-premise cloud infrastructure, unless different agreements have been made with the provider. It is always possible to download all project data locally and delete any associated media at any time. For further support on data management, contact helpdesk@eaglearca.it
Creating objects
Form (non-vector objects)
1. Open the Inventory view of the desired object class.
2. Click the New object button in the top-right corner.
3. The attribute panel opens for data entry.
Geometries (vector objects)
1. Hover over the 2D or 3D view to reveal the toolbar, then select the Draw tool.
2. To choose the object class, click the arrow next to the tool. Use the search bar at the top of the list to filter quickly, you can see a style preview to help with the selection.
3. Draw the object on the map:
-
Point
Click with the left mouse button. -
Line
To add vertices, click with the left mouse button; to close the geometry, click with the right mouse button. -
Polygon
Polygon To add vertices, click with the left mouse button; after the third vertex the polygon preview appears. To close the geometry, click with the right mouse button.
n the 3D view, objects must be created on the surface of the mesh or point cloud.
4. Once the geometry is confirmed, the attribute panel opens.
Automatic object creation
Some object classes can be configured from the Backoffice to create objects automatically.
When this function is active, it is indicated by a dedicated icon in the following places:
- At the end of the row in the object class list in the Inventory panel;
- At the top of the Inventory view of the class;
- On each automatically created element in the Inventory view list;
- In the label within the info card and the attribute details, for vector objects next to the 2D or 3D text. In the case of automatic creation, the label, showing only the icon, will also be available for Form objects.
Automatically created objects can be edited and, if needed, also created manually within the same object class.
Filling in attributes
After creation, the attribute panel allows you to enter the required information.
The object cannot be saved until all required fields have been filled in.
At the top left is the Expand button to open the panel in full screen. The Cancel and Save buttons are positioned at the top right.
If the object class has attributes organised into groups, tabs appear at the top of the panel that allow you to filter attributes by category. Clicking on a tab shows only the attributes belonging to that group. Next to the groups there is a button to expand the search bar.
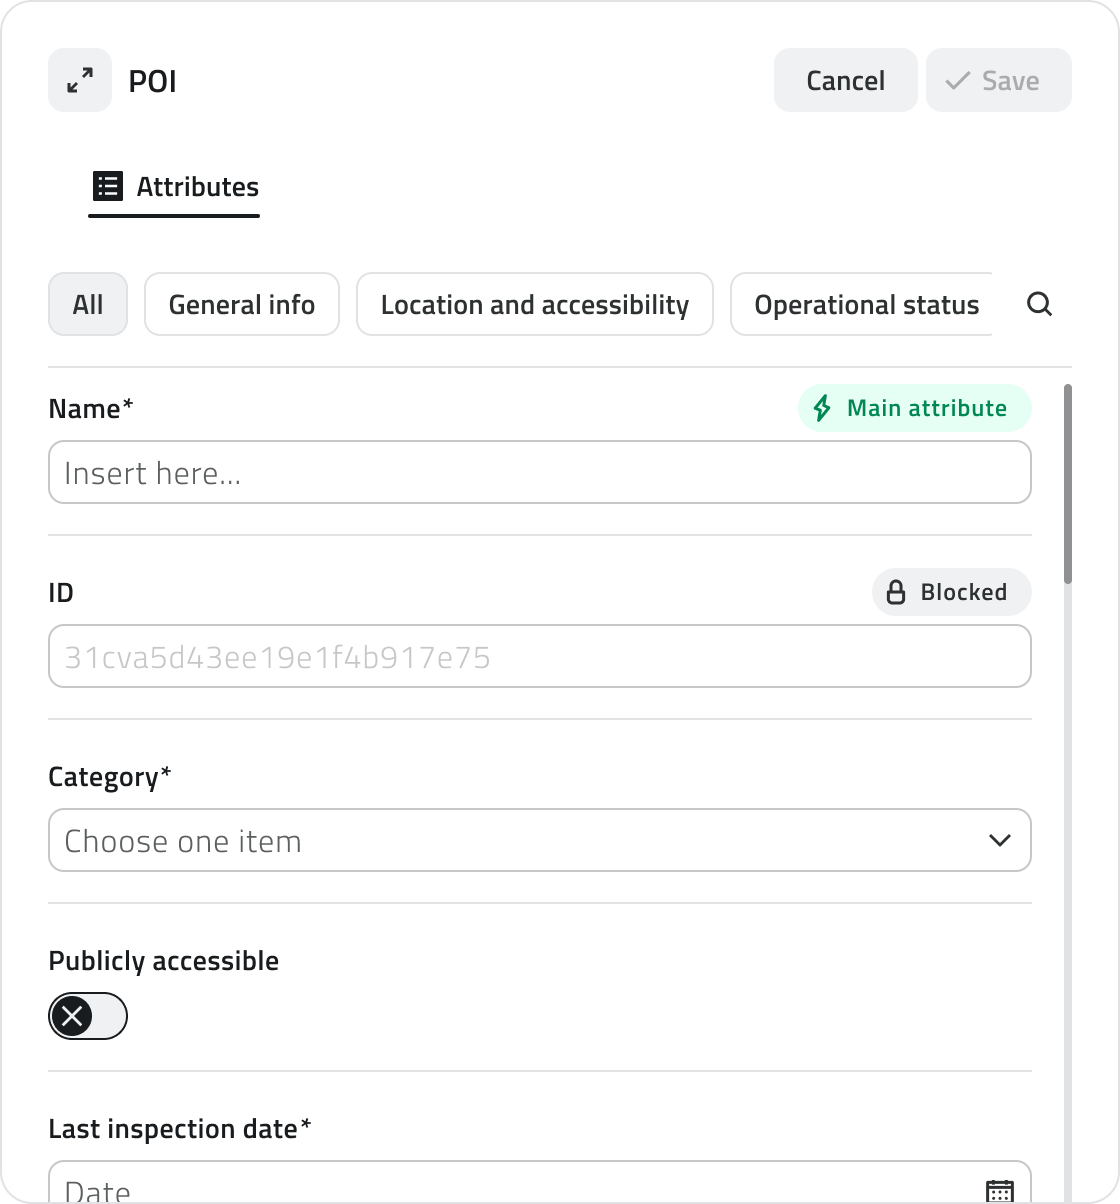
Attribute types
Objects can have the following attribute types:
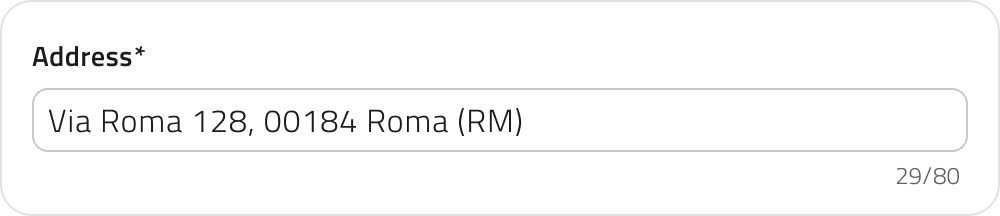
- Text: Letters and numbers (possible maximum length).
-
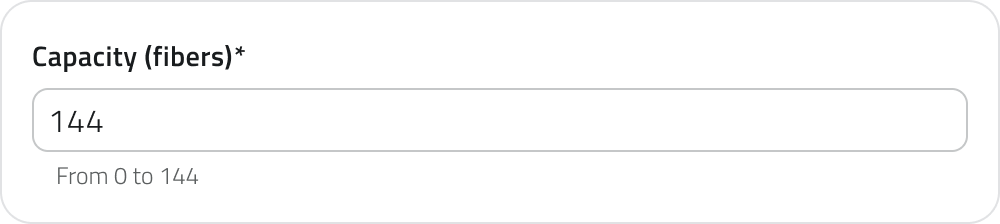
Numbers: Numeric values (possible predefined range).
-
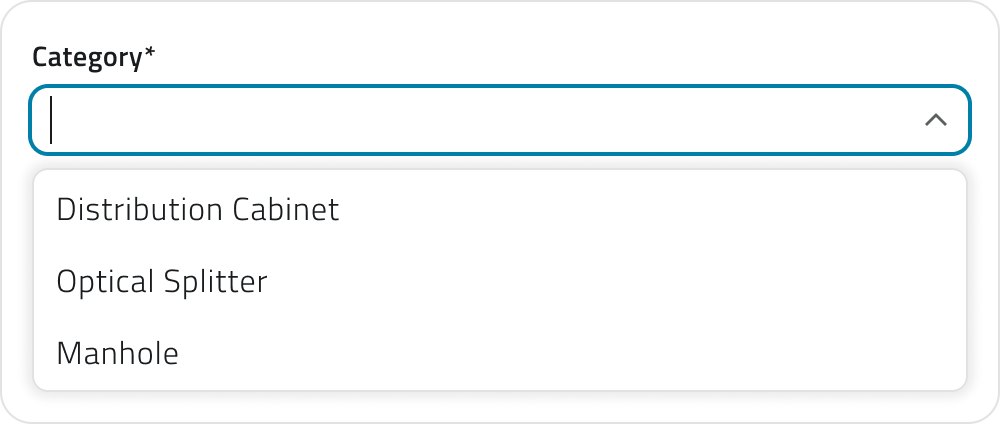
Value list: Selection of one or more values from a dropdown menu.
-
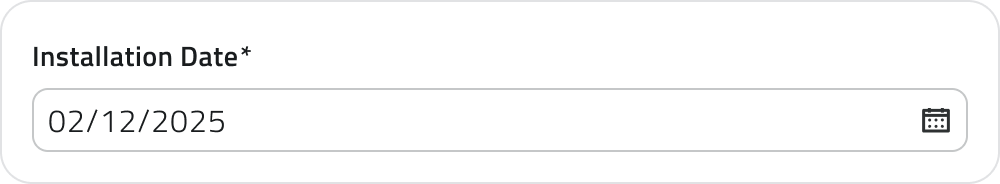
Date: Selection of a date or date and time.
-
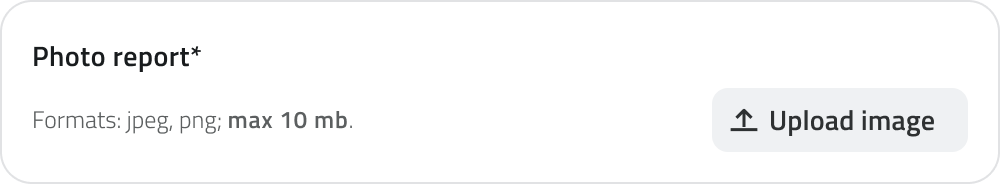
Attachments: Upload of images, documents or videos.
-
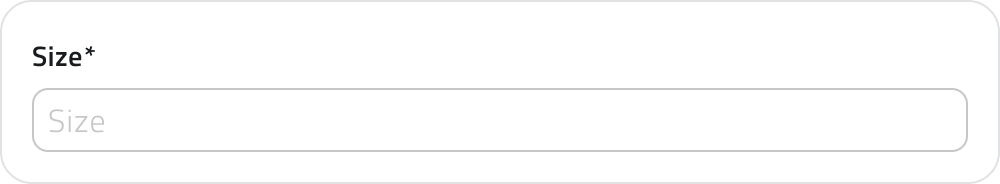
Size: (Vector only) Automatically calculated by the system (coordinates/length/area).
-
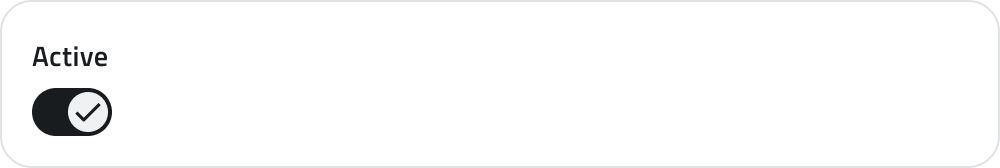
True/False: Choice between the two true/false values.
-
Object list: Addition of related sub-attributes (can be of type Text, Numbers, Value list, Date, True/False).
- Relation: link to one or more objects of another object class. Allows you to represent logical connections between project elements (e.g. a road linked to the lighting poles along its route).
Some attributes may be pre-filled with a default value: in this case they may already be ready for saving or locked and not editable.
💡 Tip: use the search bar in the attribute panel to quickly find the desired field. Make sure that any pre-filled values in mandatory fields are correct before saving.
Attribute properties
| Icon/Indicator | Property | Description |
| * (Asterisk) | Mandatory | The field must be filled in to save the object. It may have an editable pre-filled value. |
| 🔒 (Padlock) | Locked | The field cannot be edited. |
| ⚡ (Blue lightning) | Main attribute | It is mandatory and helps to quickly identify the instance. |
Assigning a data source to an object
Available only with sensors already associated with the project.
A data source is a source that collects data over time; associated with an object, it allows you to display that data as charts in the Attribute details panel.
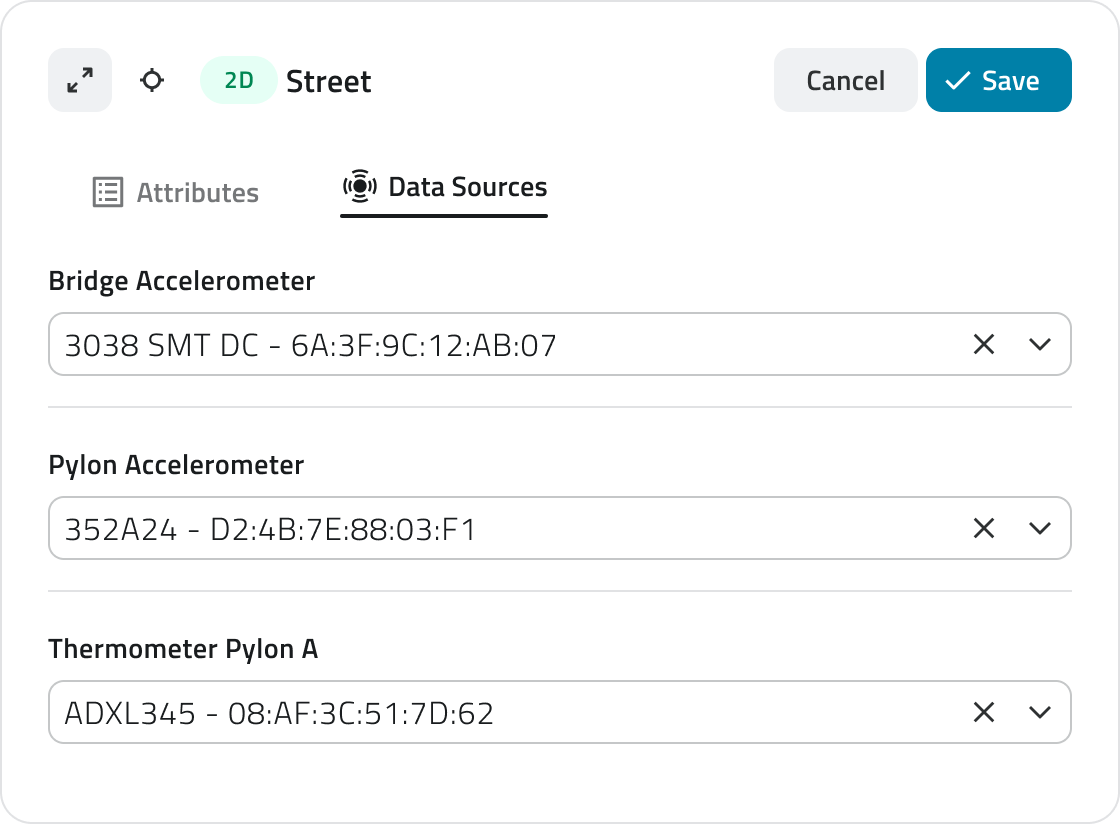
It is possible to assign a data source at two different points: during object creation or afterwards by editing an existing object.
Assignment during creation
1. During object insertion, the attribute details panel opens in configuration mode.
3. Click the selection field and choose one of the available options from the list.
Assignment during editing
1. Open the Attribute details panel of the object by clicking the blue Open button that appears when hovering over the element in the Inventory view, or select it in the 2D or 3D view and click Expand in the info card.
2. Click the Edit button.
4. Click the selection field and choose one of the available options from the list.
Managing and editing objects in the 2D view
This section provides guidance on moving, rotating, editing vertices and deleting objects.
Moving an object
The Move tool allows you to reposition selected objects with precision.
1. Select one or more objects.
2. Click the Move button in the toolbar.
3. Grab and freely move the object; snap with other objects on the map is supported.
4. To save the new position click Confirm. If the object has not been moved the button remains disabled. To restore the original position click Cancel.
Rotating an object
Rotation modifies the orientation of Line or Polygon objects.
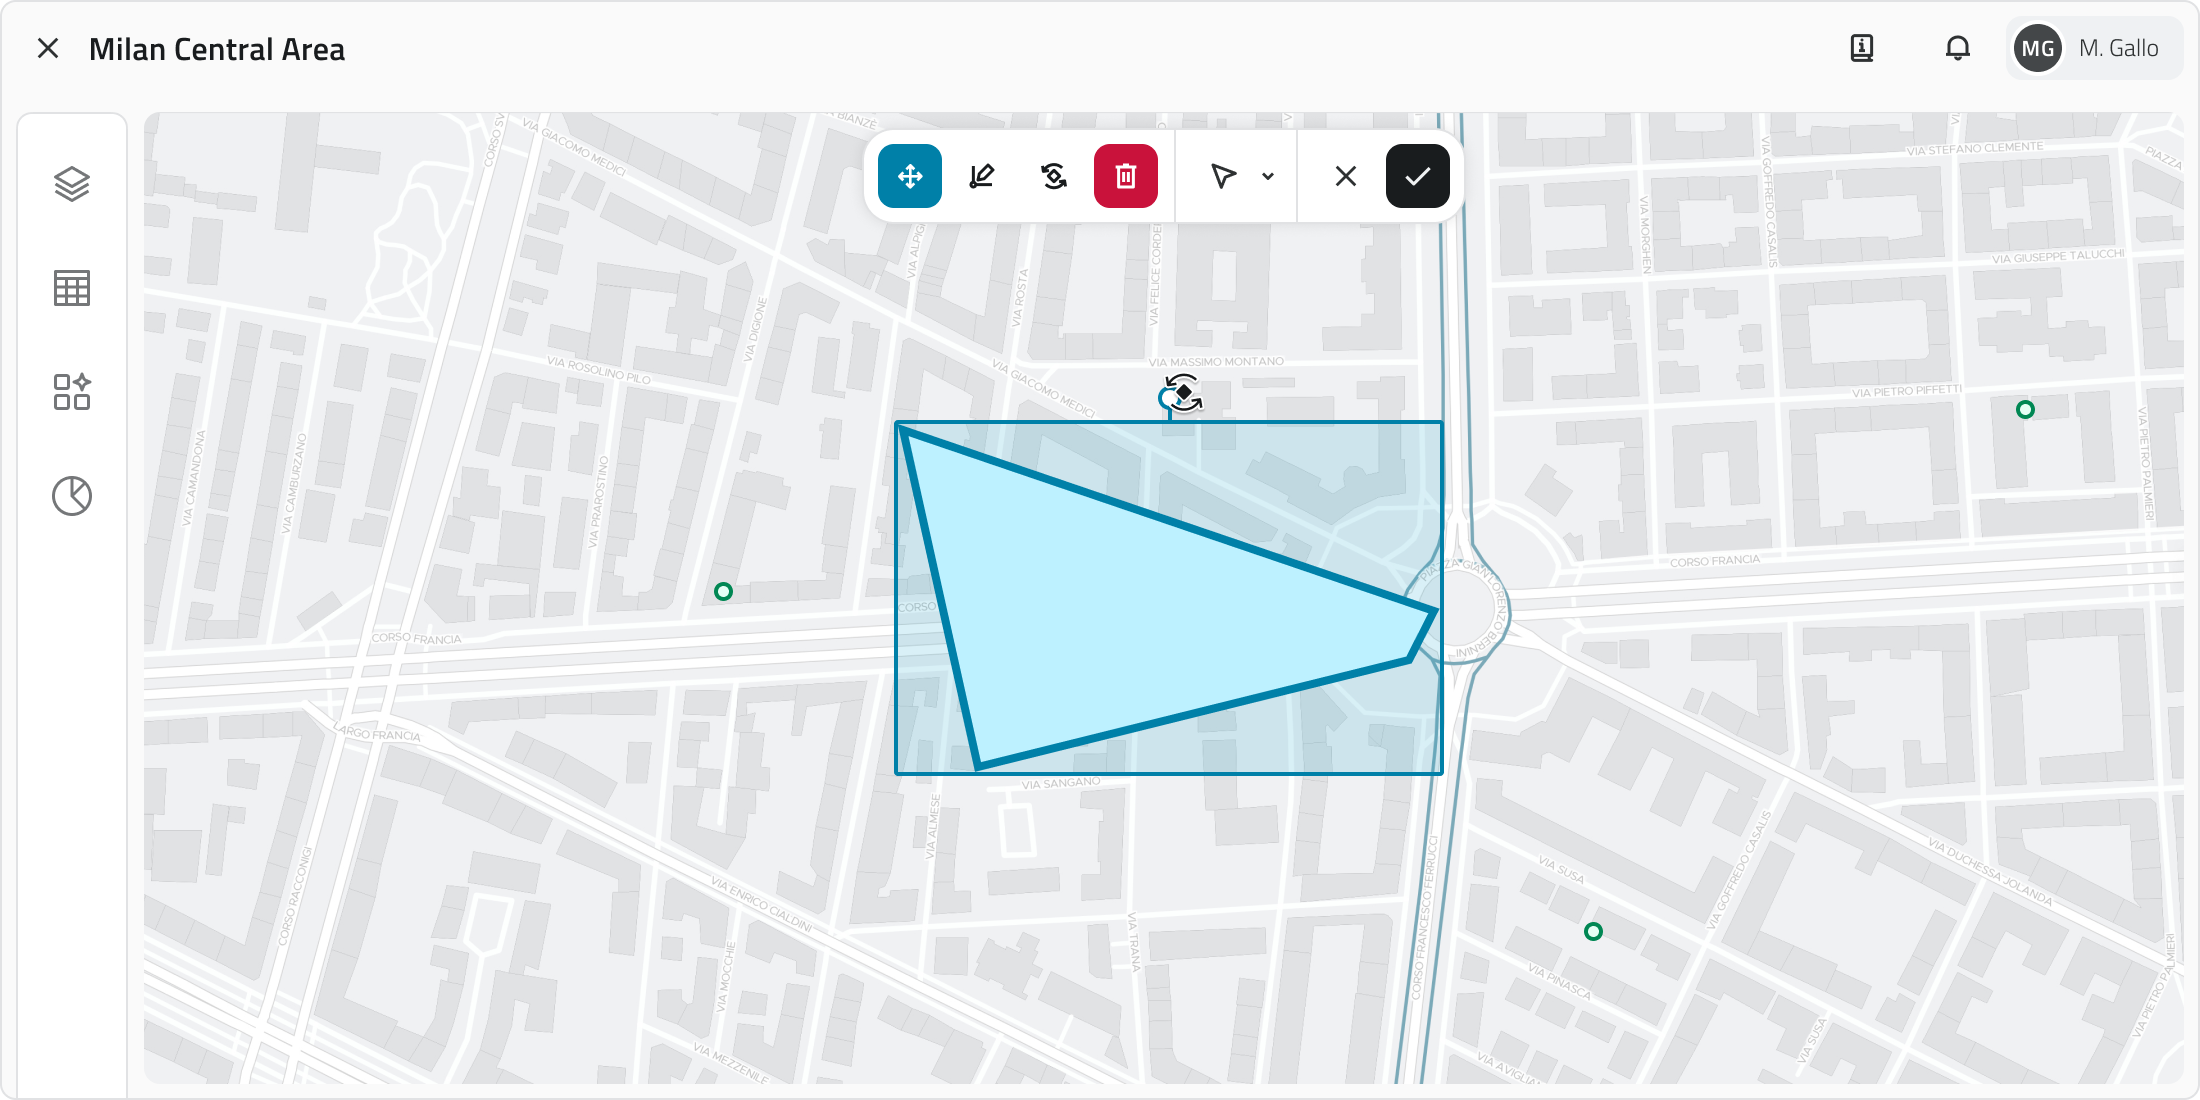
1. Select one or more objects.
2. Click the Rotate button in the toolbar. A rectangle with a handle appears around the object.
3. Drag the handle to rotate the object. Multiple rotation occurs around the central pivot point.
4. To save the new orientation click Confirm. If the object has not been rotated the button remains disabled. To restore the original orientation click Cancel.
Editing object vertices
This tool allows you to move, add or correct the vertices of Lines and Polygons.
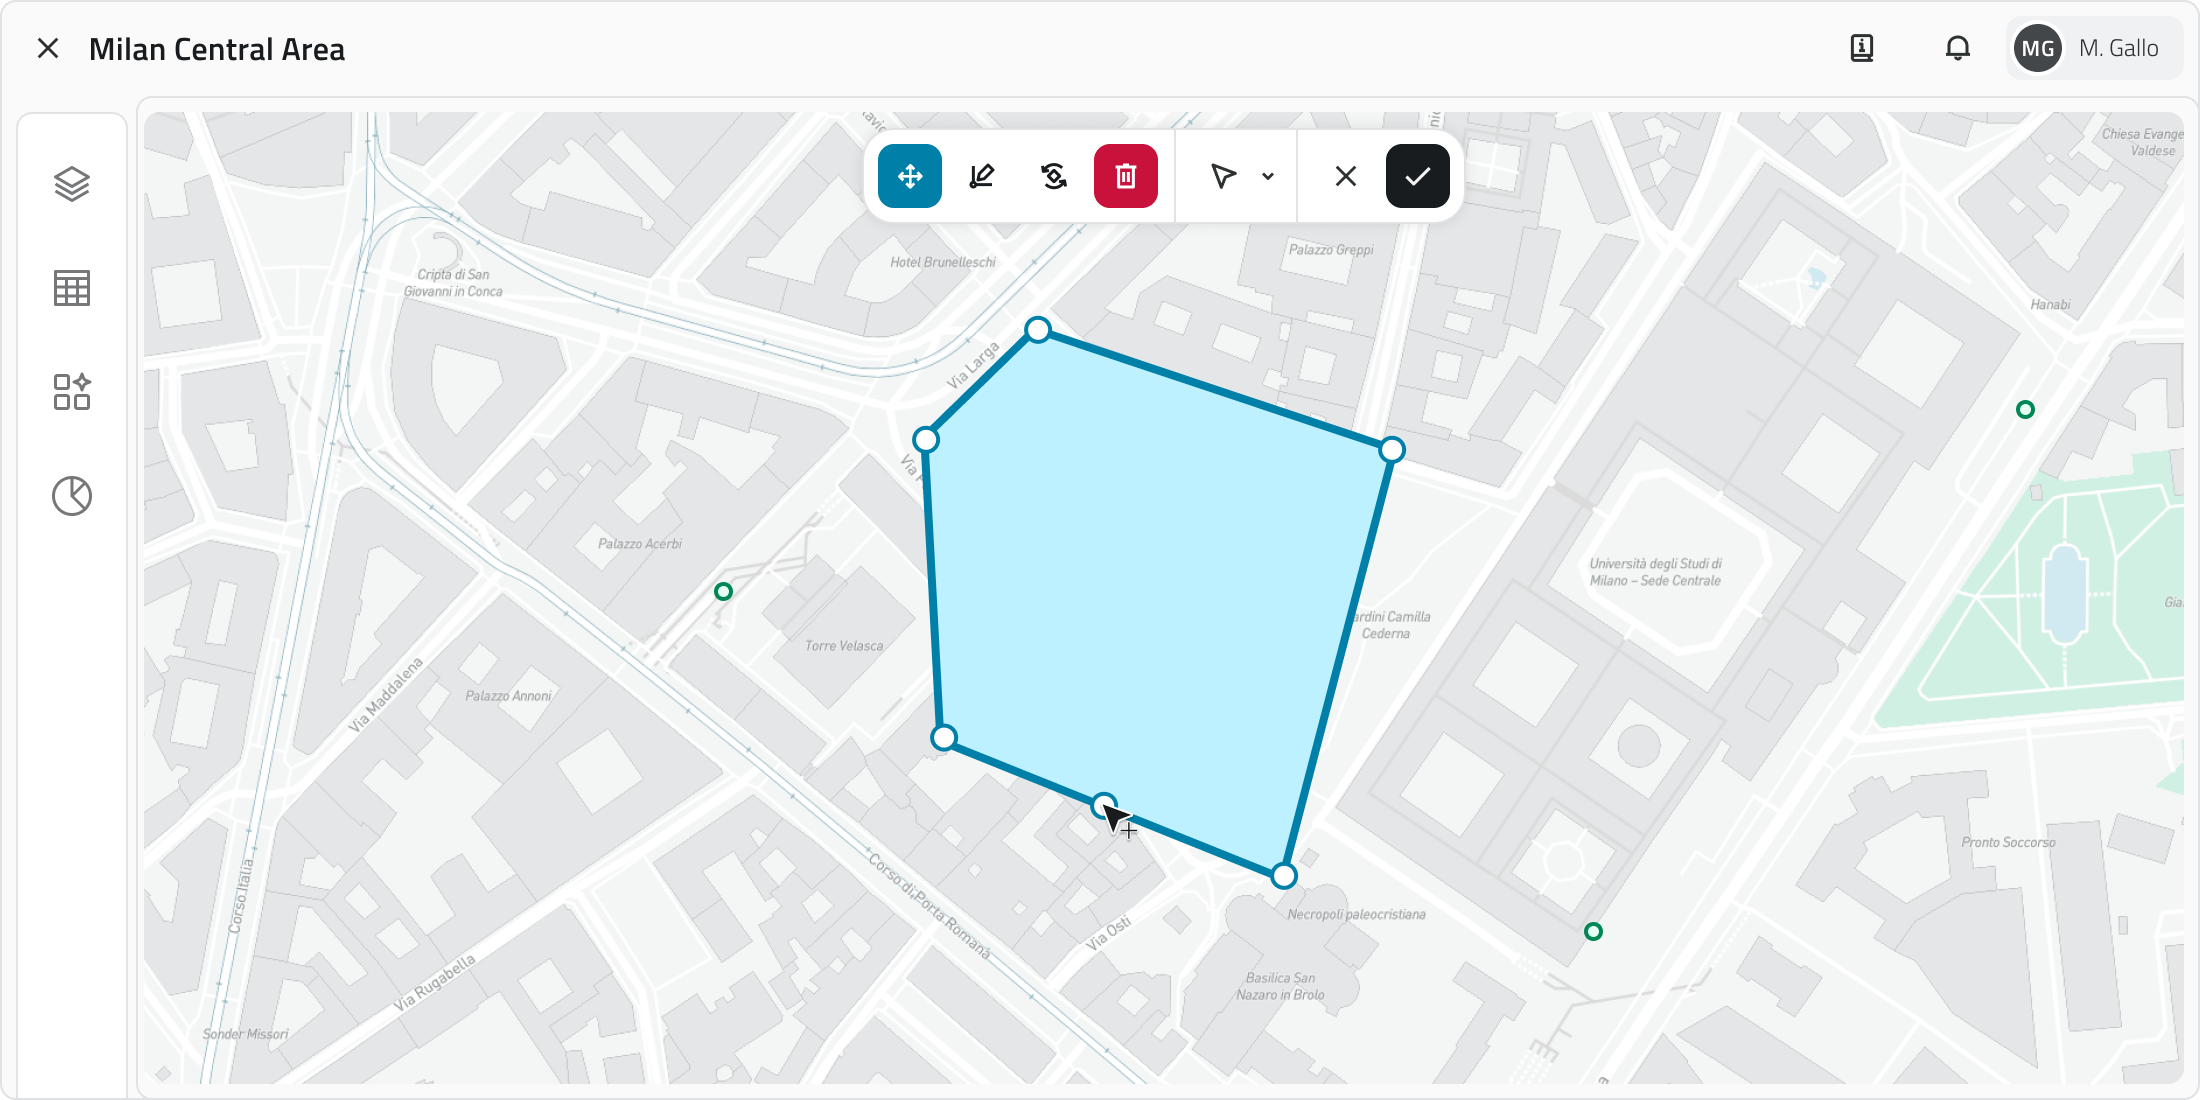
1. Select a line or polygon.
2. Click the Edit vertices button in the toolbar. All vertices become visible.
3. Drag an existing vertex to move it. To add a new vertex, click the midpoint that appears along the segment. Snap with other geometries is supported.
4. To save the changes click Confirm. If the object has not been modified the button remains disabled. To restore the original shape click Cancel.
Deleting an object
This function permanently deletes the selected objects in all views.
1. Select one or more objects in the 2D, 3D or Inventory view.
2. Click the Delete button: in the 2D and 3D views it is located in the toolbar, in the Inventory view at the top right.
3. A window opens with the list of object classes involved in the selection, each with a checkbox.
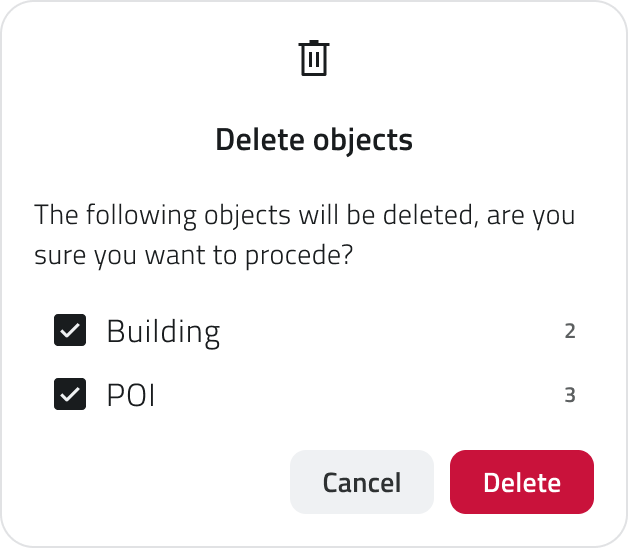
4. Select the checkboxes corresponding to the objects to delete.
5. Click Confirm to proceed, or Cancel to close the window without making any changes. The Confirm button is disabled if all checkboxes are deselected.
At the end of the operation a notification appears at the bottom left with the outcome of the deletion.
💡 Tip: always check the checkboxes in the confirmation window before proceeding to avoid deleting unwanted objects.
Links
![]() Italian version
Italian version
Questa sezione spiega come creare oggetti all’interno del progetto. Gli oggetti possono essere geometrie vettoriali, come punti, linee o poligoni, oppure oggetti non vettoriali, detti form.
Tipi di oggetti
Nel progetto puoi creare diverse tipologie di oggetti:
- Punti
Elementi singoli posizionabili nelle viste 2D e 3D, come sensori o segnaposto. - Linee
Sequenze di punti collegati per formare percorsi, come tracciati di infrastrutture. - Poligoni
Aree delimitate da più vertici, come zone di lavoro o perimetri. - Form
Oggetti non vettoriali, senza geometria, usati per inserire dati tramite attributi, come moduli informativi.
Qualsiasi dato immesso in piattaforma viene gestito su un’infrastruttura cloud on-premise, a meno di differenti accordi con il fornitore. È sempre possibile scaricare in locale tutti i dati del progetto ed eliminare qualsiasi media associato in qualsiasi momento. Per ulteriore supporto alla gestione dati, contatta l'indirizzo helpdesk@eaglearca.it
Creazione di Oggetti
Form (Oggetti non vettoriali)
1. Apri la vista Inventory della classe oggetto desiderata.
2. Clicca sul pulsante Nuovo oggetto in alto a destra.
3. Si apre il pannello attributi per la compilazione dei dati.
Geometrie (Oggetti vettoriali)
1. Passa con il mouse sulla vista 2D o 3D per far comparire la barra degli strumenti, quindi seleziona lo strumento Disegna.
2. Per scegliere la classe oggetto clicca sulla freccia accanto allo strumento. Usa la barra di ricerca in cima alla lista per filtrare rapidamente, puoi vedere l'anteprima dello stile per facilitare la selezione.
3. Disegna l’oggetto sulla mappa:
-
Punto
Clicca con il tasto sinistro del mouse. -
Linea
Per inserire i vertici, clicca con il tasto sinistro del mouse, per chiudere la geometria, clicca con il tasto destro. -
Poligono
Per inserire i vertici, clicca con il tasto sinistro del mouse, dopo il terzo vertice appare l'anteprima del poligono. Per chiudere la geometria, clicca con il tasto destro.
Nella vista 3D gli oggetti devono essere creati necessariamente sulla superficie della mesh o della nuvola di punti.
4. Confermata la geometria, si apre il pannello attributi.
Creazione automatica degli oggetti
Alcune classi oggetto possono essere configurate dal Backoffice per creare oggetti in automatico.
Quando questa funzione è attiva, è segnalata da un'icona dedicata individuabile nei seguenti punti:
- A fine riga nella lista delle classi oggetto nel pannello Inventory;
- In cima alla vista Inventory della classe;
- Su ogni elemento creato automaticamente nell'elenco della vista Inventory;
- Nell'etichetta all'interno dell'info card e del dettaglio attributi, per gli oggetti vettoriali accanto alla scritta 2D o 3D.
In caso di creazione automatica, l'etichetta, con solo l'icona, sarà disponibile anche per oggetti di tipo Form.
Gli oggetti creati automaticamente possono essere modificati e, se necessario, creati anche manualmente nella stessa classe oggetto.
Compilazione degli Attributi
Dopo la creazione, il pannello attributi permette di inserire le informazioni richieste.
L'oggetto non può essere salvato finché tutti i campi obbligatori non sono compilati.
In alto a sinistra si trova il pulsante Espandi per aprire il pannello a schermo intero. I bottoni Annulla e Salva sono posizionati in alto a destra.
Se la classe oggetto ha attributi organizzati in gruppi, nella parte superiore del pannello compaiono delle schede che permettono di filtrare gli attributi per categoria. Cliccando su una scheda vengono mostrati solo gli attributi appartenenti a quel gruppo. Accanto ai gruppi è presente un pulsante per espandere la barra di ricerca.
Tipi di Attributi
Gli oggetti possono avere i seguenti tipi di attributi:
-
Testo: Lettere e numeri (possibile lunghezza massima).
-
Numeri: Valori numerici (possibile range predefinito).
-
Lista valori: Selezione di uno o più valori da un menu a tendina.
-
Data: Scelta di una data o data e ora.
-
Allegati: Caricamento di immagini, documenti o video.
-
Dimensione: (Solo vettoriali) Calcolata automaticamente dal sistema (coordinate/lunghezza/area).
-
Vero/Falso: Scelta tra i due valori vero/falso.
-
Lista oggetti: Aggiunta di sotto-attributi correlati (possono essere di tipo Testo, Numeri, Lista valori, Data, Vero/Falso).
- Relazione: collegamento a uno o più oggetti di un'altra classe oggetto. Permette di rappresentare legami logici tra elementi del progetto (es. una strada collegata ai pali dell'illuminazione lungo il suo tracciato).
Alcuni attributi possono essere precompilati con un valore di default: in questo caso potrebbero essere già pronti per il salvataggio oppure bloccati e non modificabili.
💡 Suggerimento: usa la barra di ricerca nel pannello attributi per trovare rapidamente il campo desiderato. Verifica che i valori precompilati nei campi obbligatori siano corretti prima di salvare.
Proprietà degli Attributi
| Icona/Indicatore | Proprietà | Descrizione |
| * (Asterisco) | Obbligatorio | Il campo deve essere compilato per salvare l’oggetto. Può avere un valore precompilato modificabile. |
| 🔒 (Lucchetto) | Bloccato | Il campo non è modificabile. |
| ⚡ (Fulmine azzurro) | Attributo principale | È obbligatorio e aiuta a riconoscere rapidamente l’istanza. |
Assegnare Sorgenti dati ad un oggetto
Disponibile solo con sensori già associati al progetto.
Una sorgente dati è una fonte che raccoglie dati nel tempo; associata a un oggetto, consente di visualizzare tali dati come grafici nel pannello Dettaglio attributi.
È possibile assegnare una sorgente dati in due momenti distinti: durante la creazione dell'oggetto oppure in un secondo momento modificando un oggetto già esistente.
Assegnazione in creazione
1. Durante l'inserimento dell'oggetto si apre il dettaglio attributi in configurazione.
2. Spostati nella sezione Sorgente dati.
3. Clicca nel campo di selezione e scegli una delle opzioni disponibili dall'elenco.
Assegnazione in modifica
2. Clicca sul pulsante Modifica.
3. Spostati nella sezione Sorgente dati.
4. Clicca nel campo di selezione e scegli una delle opzioni disponibili dall'elenco.
Gestione e modifica di oggetti nella vista 2D
Questa sezione fornisce le indicazioni relative allo spostamento, alla rotazione, alla modifica dei vertici e all'eliminazione degli oggetti.
Spostare un oggetto
Lo strumento Sposta consente di riposizionare con precisione gli oggetti selezionati.
1. Seleziona uno o più oggetti.
2. Clicca sul pulsante Sposta nella barra degli strumenti.
3. Afferra e sposta liberamente l'oggetto; è supportato lo snap con altri oggetti sulla mappa.
4. Per salvare la nuova posizione clicca Conferma. Se l'oggetto non è stato spostato il pulsante rimane disabilitato. Per ripristinare la posizione originale clicca Annulla.
Ruotare un oggetto
La rotazione modifica l'orientamento di oggetti di tipo Linea o Poligono.
1. Seleziona uno o più oggetti.
2. Clicca sul pulsante Ruota nella barra degli strumenti. Appare un rettangolo con una maniglia attorno all'oggetto.
3. Trascina la maniglia per ruotare l'oggetto. La rotazione multipla avviene attorno al punto di pivot centrale.
4. Per salvare il nuovo orientamento clicca Conferma. Se l'oggetto non è stato ruotato il pulsante rimane disabilitato. Per ripristinare l'orientamento originale clicca Annulla.
Modificare i vertici di un oggetto
Questo strumento consente di spostare, aggiungere o correggere i vertici di Linee e Poligoni.
1. Seleziona una linea o un poligono.
2. Clicca sul pulsante Modifica vertici nella barra degli strumenti. Tutti i vertici diventano visibili.
3. Trascina un vertice esistente per spostarlo. Per aggiungere un nuovo vertice, clicca sul punto intermedio che compare lungo il segmento. È possibile usare lo snap con altre geometrie.
4. Per salvare la modifica clicca Conferma. Se l'oggetto non è stato modificato il pulsante rimane disabilitato. Per ripristinare la forma originale clicca Annulla.
Eliminare un Oggetto
Questa funzione elimina definitivamente gli oggetti selezionati in tutte le viste.
1. Seleziona uno o più oggetti nella vista 2D, 3D o Inventory.
2. Clicca sul pulsante Elimina: nelle viste 2D e 3D si trova nella barra degli strumenti, nella vista Inventory in alto a destra.
3. Si apre una finestra con l'elenco delle classi oggetto coinvolte nella selezione, ciascuna con una casella di spunta.
4. Seleziona le caselle corrispondenti agli oggetti da eliminare.
5. Clicca Conferma per procedere, oppure Annulla per chiudere la finestra senza apportare modifiche.
Il pulsante Conferma è disabilitato se tutte le caselle sono deselezionate.
Al termine dell'operazione compare una notifica in basso a sinistra con l'esito dell'eliminazione.
💡 Suggerimento: controlla sempre le caselle nella finestra di conferma prima di procedere per evitare di eliminare oggetti non desiderati.
Collegamenti
Last update: 22 May 2026
Manage object relations
![]() English version
English version
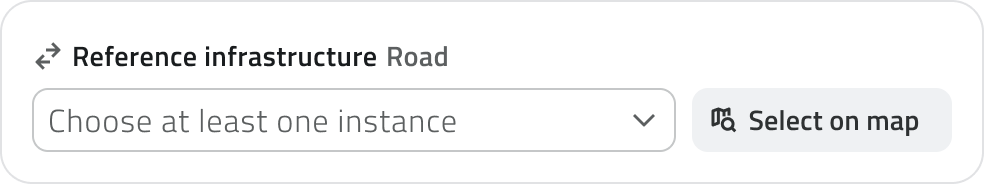
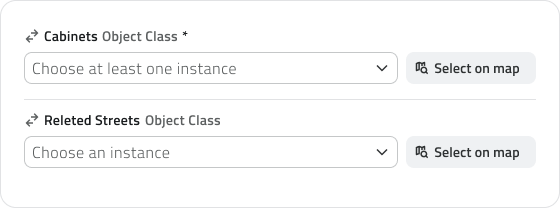
Relations are a type of attribute that allows you to link an object to one or more objects belonging to another object class. They are used to represent logical connections between project elements: for example, a road linked to the lighting poles along its route, or an inspection associated with the infrastructure it refers to.
Creating an object
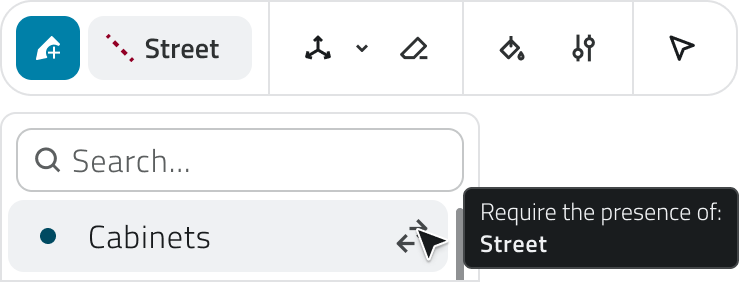
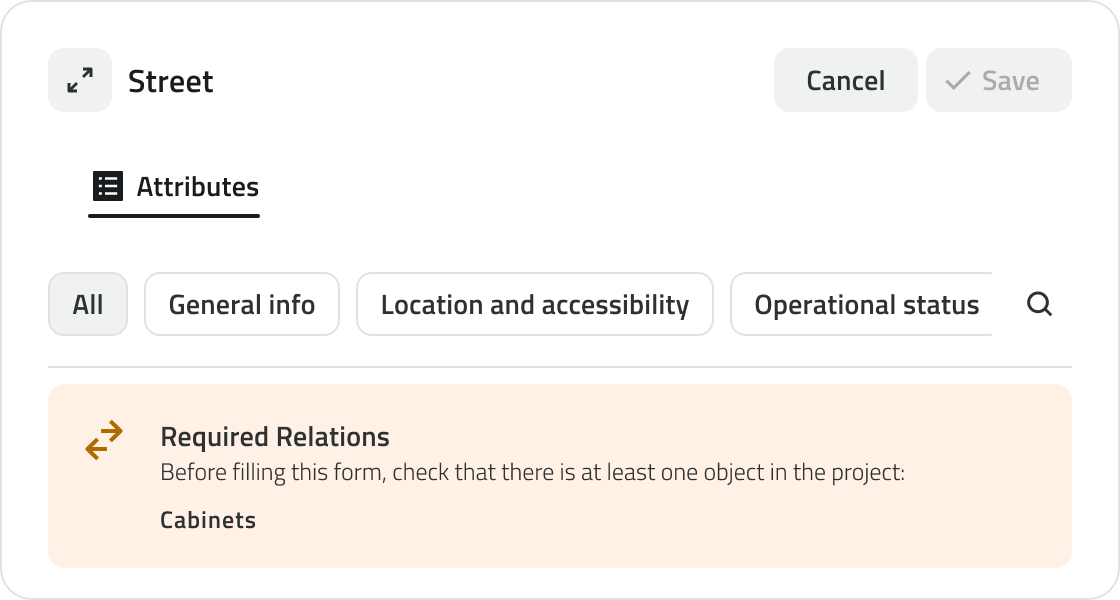
When you create a new object using the Draw tool, the system indicates if the object class requires mandatory relations.
In the object class selection menu, a relation icon appears next to classes that require mandatory links. Hovering over the icon shows a summary of the classes to be linked.
Attribute details
In projects, relations between objects are visible in the Attribute details panel.
They are displayed as relation-type attributes, identifiable by the double arrow icon, and show the objects linked to the one whose details you are viewing.
For each relation, the display name of the linked object, its main attribute and any additional attributes configured in the Backoffice are shown.
If the relation is of type 1:N or N:N, a list of related objects is displayed.
Linking objects
To link an object to another through a relation, locate the relation-type attribute in the attribute panel during object creation or editing.
You can select the object to link using the dropdown menu or, for vector objects, by clicking the Select on map button to choose directly from the map or from the Inventory view. The selection is synchronised between the two views.
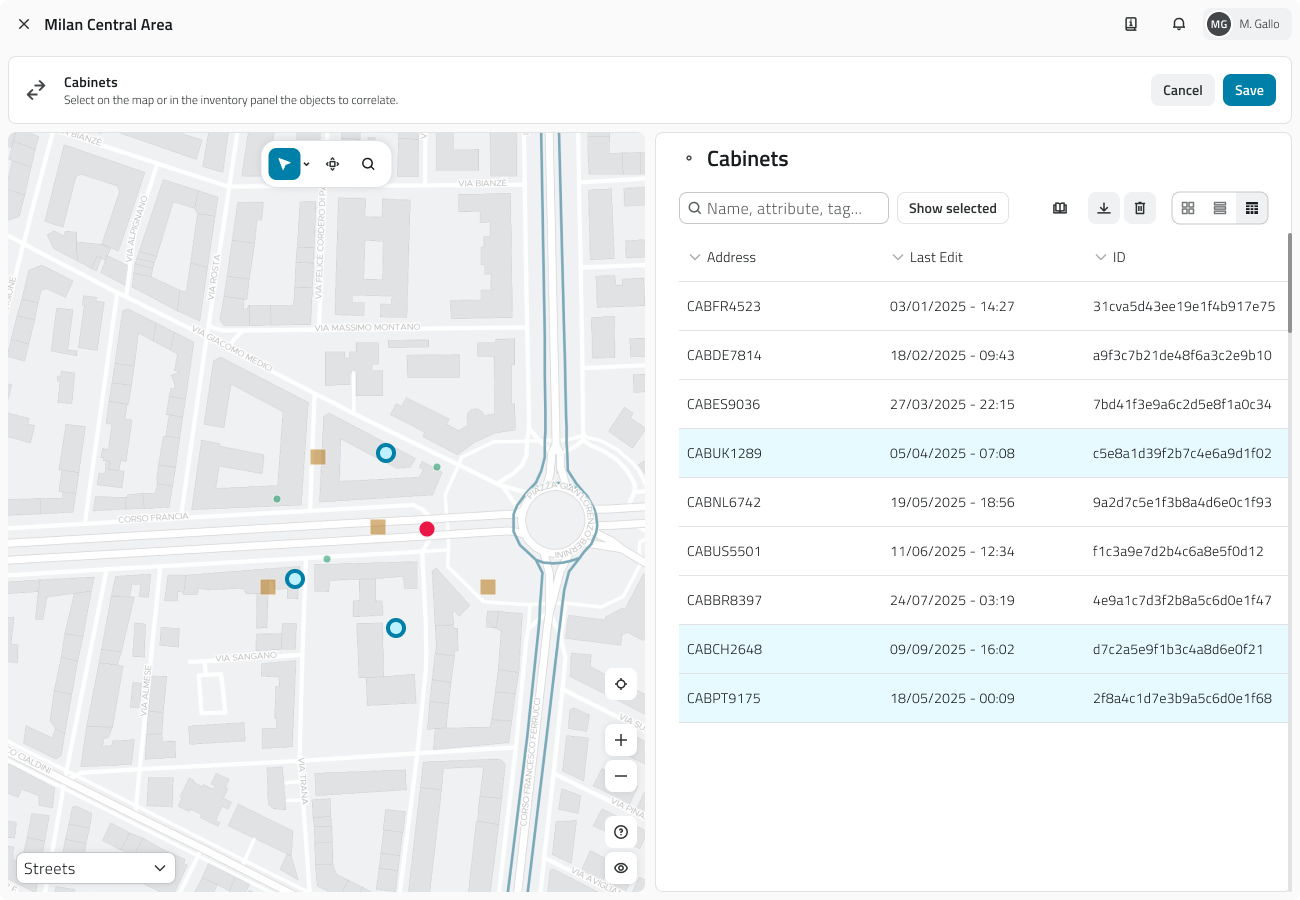
💡 Tip: for vector objects, selecting from the map is often faster than searching the list. Make sure that objects of the class to be linked exist before proceeding.
Mandatory relations
When a relation is configured as mandatory, an object cannot exist without being linked to at least one object of the other class. This has some operational implications:
- Both object classes involved must be included in the project configuration;
- It is not possible to save an object without having selected at least one related object;
- Deleting an object required for the existence of another linked object will cause the system to automatically delete the latter as well.
Editing relations
To edit an existing relation, open the Attribute details panel of the object and click Edit. The available actions depend on the type of relation configured:
- If the relation is not mandatory for either class, you can freely add, replace or remove linked objects;
- If the relation is mandatory for the object you are editing, you can replace the linked object but not remove it without adding another one, as the object cannot exist without that link;
- If the relation is mandatory for the linked object, the link cannot be removed: the linked object could not exist without this connection. To dissolve it, the linked object must be deleted directly.
Links
![]() Italian version
Italian version
Le relazioni sono un tipo di attributo che permette di collegare un oggetto ad uno o più oggetti appartenenti a un'altra classe oggetto. Servono a rappresentare legami logici tra elementi del progetto: ad esempio, una strada collegata ai pali dell'illuminazione lungo il suo tracciato, o un'ispezione associata all'infrastruttura a cui si riferisce.
Creazione di un oggetto
Quando crei un nuovo oggetto utilizzando lo strumento Disegna, il sistema segnala se la classe oggetto richiede relazioni obbligatorie.
Dettaglio attributi
Nei progetti, le relazioni tra oggetti sono visibili nel pannello Dettaglio attributi.
Vengono mostrate come attributi di tipo relazione, identificabili dall'icona con la doppia freccia, e mostrano gli oggetti collegati a quello di cui stai visualizzando i dettagli.
Per ogni relazione vengono mostrati il nome visualizzato dell'oggetto collegato, il suo attributo principale ed eventuali attributi aggiuntivi configurati nel Backoffice.
Se la relazione è di tipo 1:N o N:N, viene mostrata una lista di oggetti relazionati.
Relazionare gli oggetti
Per collegare un oggetto ad un altro tramite una relazione, individua l'attributo di tipo relazione nel pannello attributi durante la creazione o la modifica dell'oggetto.
Puoi selezionare l'oggetto da collegare tramite il menu a tendina oppure, per gli oggetti vettoriali, cliccando sul pulsante Seleziona da mappa per scegliere direttamente dalla mappa o dalla vista Inventory. La selezione è sincronizzata tra le due viste.
Il pulsante Salva diventa disponibile solo dopo aver selezionato almeno un oggetto valido.
💡 Suggerimento: Per oggetti vettoriali la selezione da mappa è spesso più rapida rispetto alla ricerca nella lista. Assicurati che esistano oggetti della classe da collegare prima di procedere con la modifica.
Relazioni obbligatorie
Quando una relazione è configurata come obbligatoria, un oggetto non può esistere senza essere collegato ad almeno un oggetto dell'altra classe. Questo comporta alcune implicazioni operative:
- Entrambe le classi oggetto coinvolte devono essere incluse nella configurazione del progetto;
- Non è possibile salvare un oggetto senza aver selezionato almeno un oggetto relazionato;
- Eliminando un oggetto necessario per l'esistenza di un altro oggetto collegato, il sistema elimina automaticamente anche quest'ultimo.
Modificare le relazioni
Per modificare una relazione esistente, apri il pannello Dettaglio attributi dell'oggetto e clicca su Modifica.
Le possibilità di intervento dipendono dalla tipologia di relazione configurata:
- Se la relazione non è obbligatoria per nessuna delle due classi, puoi liberamente aggiungere, sostituire o rimuovere gli oggetti collegati;
- Se la relazione è obbligatoria per l'oggetto che stai modificando, puoi sostituire l'oggetto collegato ma non rimuoverlo senza aggiungerne un altro, poiché l'oggetto non può esistere senza quel collegamento;
- Se la relazione è obbligatoria per l'oggetto collegato, non è possibile rimuovere il collegamento: l'oggetto collegato non potrebbe esistere senza questo legame. Per scioglierlo è necessario eliminare direttamente l'oggetto collegato.
Collegamenti
Last update: 22 May 2026
Measuring in 2D and 3D views
![]() English version
English version
The Measure function, accessible from the toolbar by hovering over the view, allows you to calculate coordinates, distances, areas, angles and heights in both 2D and 3D environments.
For Coordinate, Distance, and Polygon Area measurements, object class snapping is enabled for better accuracy.
Measuring in the 2D View
Measurements in the 2D View calculate georeferenced measures directly on the map.
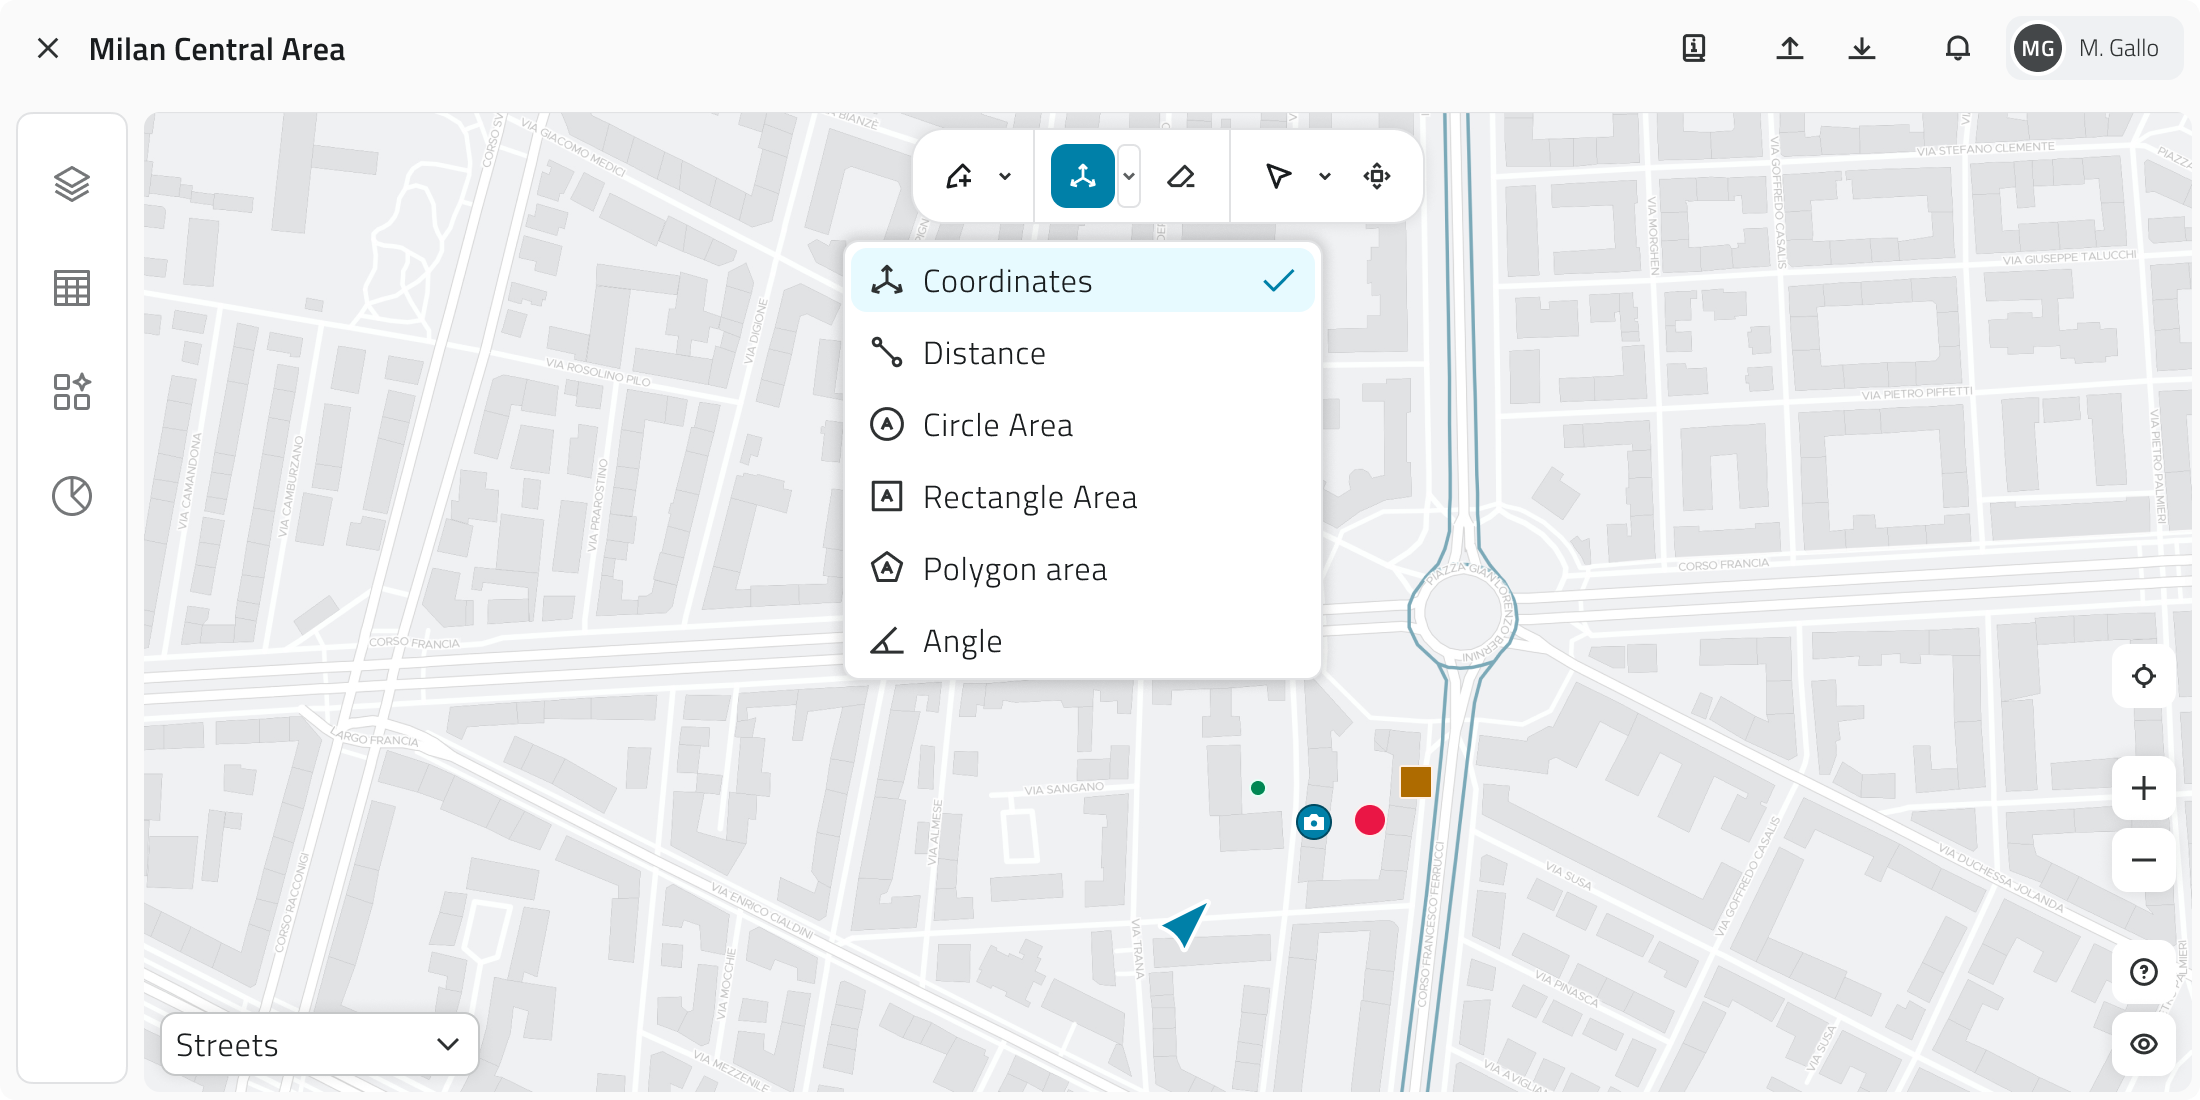
| Measurement type | Action | Result |
| Coordinates | Left-click to fix the point. | Point coordinates. |
| Distance | Left-click to add points, right-click to close. | Total length and length of each segment. |
| Circle area | Left-click and drag. | Area. |
| Rectangle area | Left-click and drag. | Area and length of each side. |
| Polygon area | Left-click to add points, right-click to close. | Area and length of the segments. |
| Angle | Three left-clicks to fix the measurement. | Measurement in degrees. |
To delete a measurement click the X next to its label.
If you want to remove all measurements from the view, click the Clear measurements button in the toolbar.
Measuring in the 3D View
Measurements in the 3D View calculate measures in three-dimensional space. They only work if the measurement is taken on top of the point cloud or mesh.
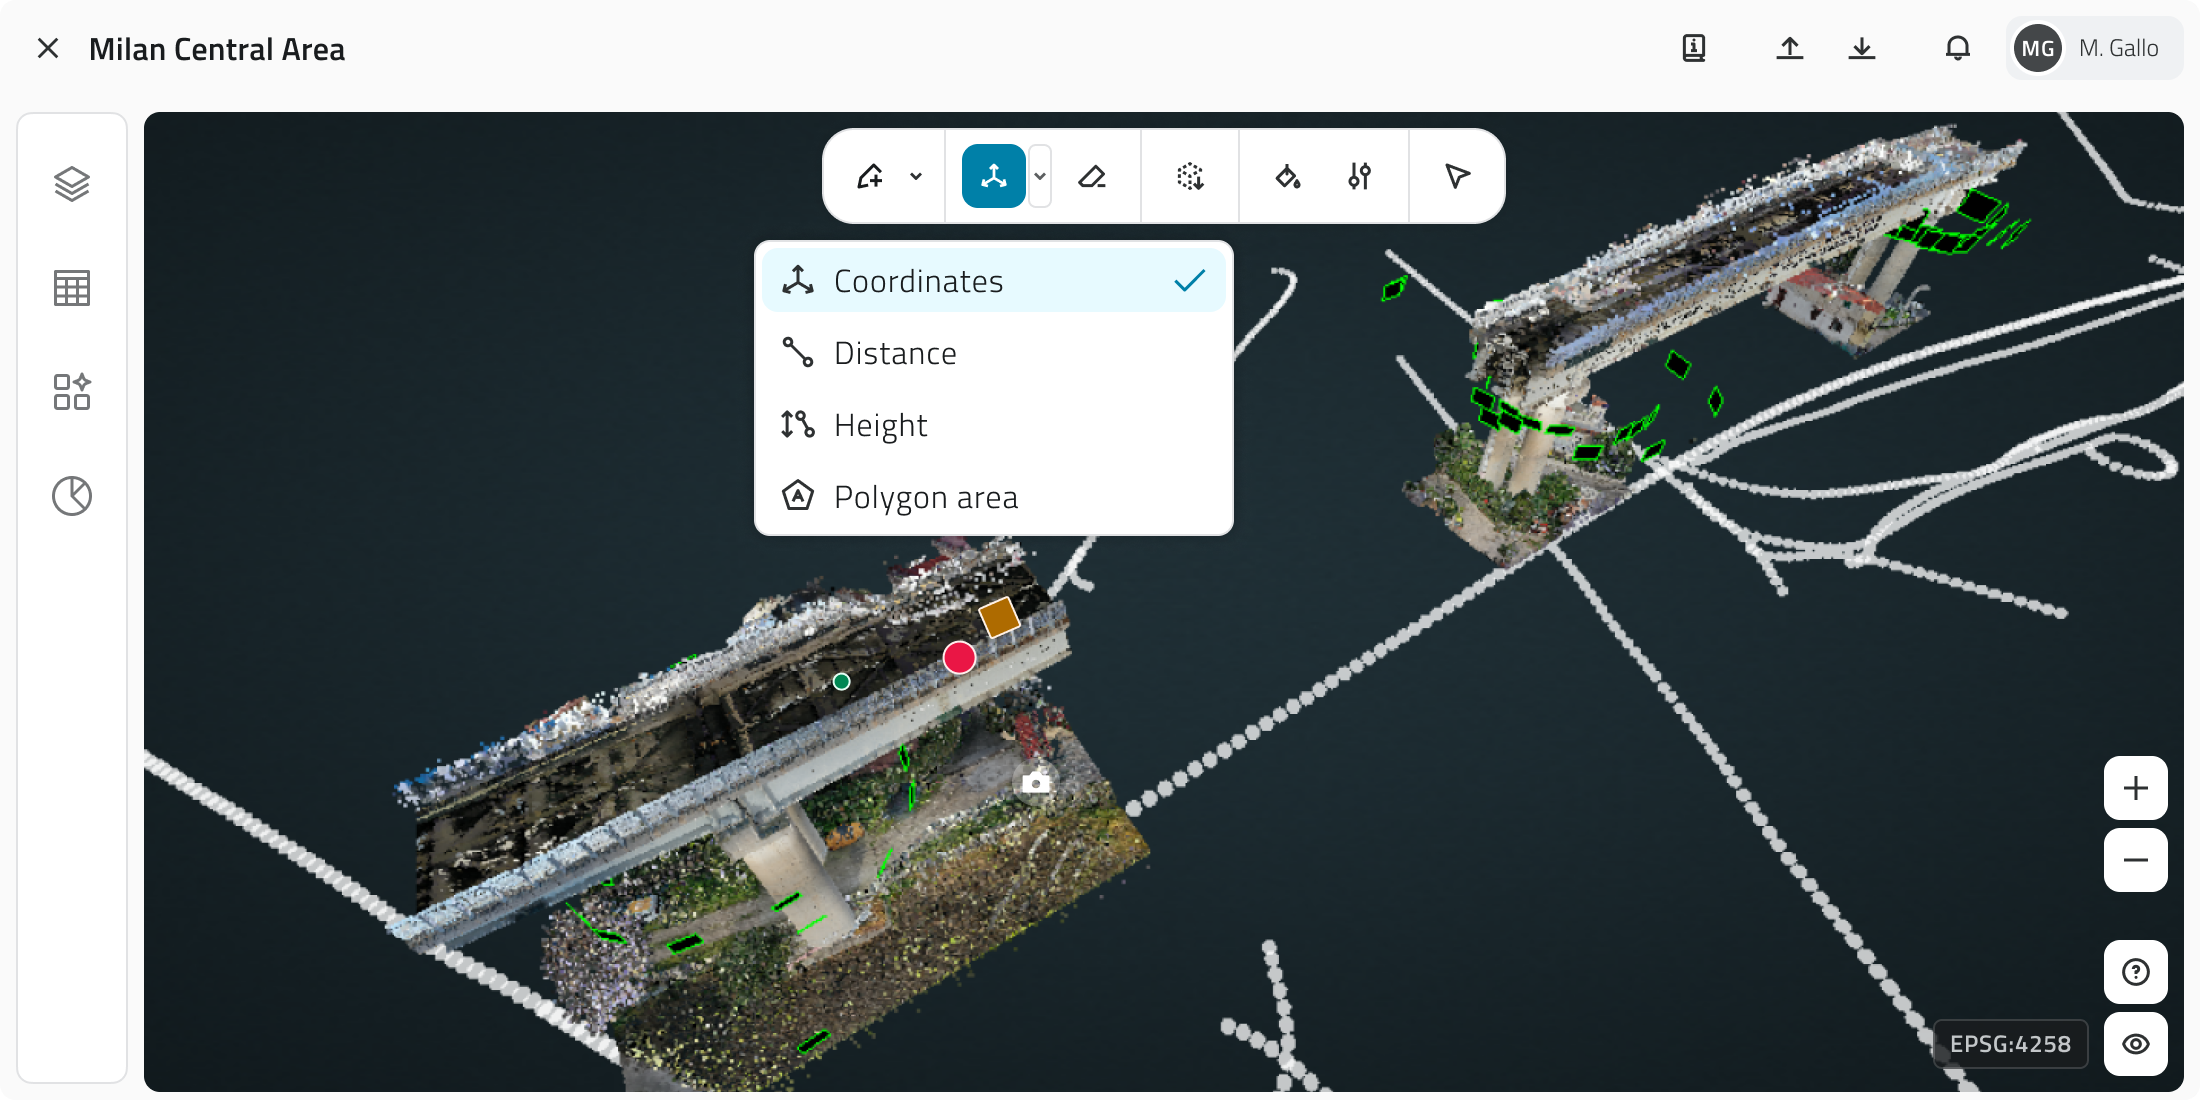
| Measurement type | Action | Result |
| Coordinates | Left-click to fix the point. | Point coordinates. |
| Distance | Left-click to add points, right-click to close. | Total length and length of each segment. |
| Height | Two left-clicks (start and end point). | Difference in elevation between the two points. |
| Polygon area | Left-click to add points, right-click to close. | Area. |
To delete a measurement click the X next to its label; if you want to remove all measurements from the view, click the Clear measurements button in the toolbar.
💡 Tip: use the Height measurement to compare elevations or detect level differences between elements in the 3D scene.
Measurements are not permanently saved, refreshing the page will cause all measurements to be lost.
Links
![]() Italian version
Italian version
La funzione Misura, accessibile dalla barra degli strumenti passando con il mouse sulla vista, permette di calcolare coordinate, distanze, aree, angoli e altezze in entrambi gli ambienti 2D e 3D.
Nelle misurazioni di tipo Coordinate, Distanza e Area poligono è attivo lo snap sulle classi oggetto per una maggiore precisione.
Misurare nella Vista 2D
La misurazione nella Vista 2D calcola misure georeferenziate direttamente sulla mappa.

| Tipo di Misurazione | Azione | Risultato |
| Coordinate | Clic tasto sinistro per fissare il punto. | Coordinate del punto. |
| Distanza | Clic tasto sinistro per aggiungere punti, clic tasto destro per chiudere. | Lunghezza totale e di ogni segmento. |
| Area cerchio | Clic tasto sinistro e trascina. | Area. |
| Area rettangolo | Clic tasto sinistro e trascina. | Area e lunghezza di ogni lato. |
| Area poligono | Clic tasto sinistro per punti, clic tasto destro per chiudere. | Area e lunghezza dei segmenti. |
| Angolo | Tre clic tasto sinistro per fissare la misura. | Misura in gradi. |
Per eliminare una misura clicca sulla X accanto alla sua etichetta.
Se invece vuoi rimuovere tutte le misure dalla vista, clicca sul pulsante Cancella misure nella barra degli strumenti.
Misurare nella Vista 3D
La misurazione nella Vista 3D calcola misure nello spazio tridimensionale. Funziona solo se la misura è eseguita sopra la nuvola di punti o la mesh.
| Tipo di Misurazione | Azione | Risultato |
| Coordinate | Clic tasto sinistro per fissare il punto. | Coordinate del punto. |
| Distanza | Clic tasto sinistro per punti, Clic tasto destro per chiudere. | Lunghezza totale e di ogni segmento. |
| Altezza | Due clic tasto sinistro (punto iniziale e finale). | Differenza di quota (altezza) tra i due punti. |
| Area poligono | Clic tasto sinistro per punti, Clic tasto destro per chiudere. | Area. |
Per eliminare una misura clicca sulla X accanto alla sua etichetta; se invece vuoi rimuovere tutte le misure dalla vista, clicca sul pulsante Cancella misure nella barra degli strumenti.
💡 Suggerimento: usa la misura Altezza per confrontare quote o rilevare differenze di livello tra elementi nella scena 3D.
Le misurazioni non vengono salvate in modo permanente, aggiornando la pagina tutte le misure andranno perse.
Collegamenti
Last update: 21 May 2026
Customize the 3D view
![]() English version
English version
The Style and Settings functions allow you to customise the visual appearance, orientation and navigation dynamics of the three-dimensional scene. Both are accessible from the toolbar by hovering over the 3D view.
Modifying the 3D View Style
The Style function (bucket icon) allows you to adjust point colours, background, element visibility and background grid parameters.
![]()
At the top there is a Reset button that restores all Style settings to their default values
Points
Applicable only when point clouds are present.
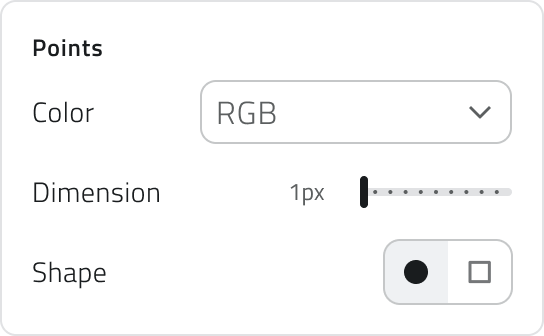
| Parameter | Customisation details |
| Colour | Various modes available (e.g. RGB, Depth, Elevation, Intensity, Normal, Composite). |
| Size | Adjustable between 1 and 10 pixels. |
| Shape | Choose between circles and squares. |
General
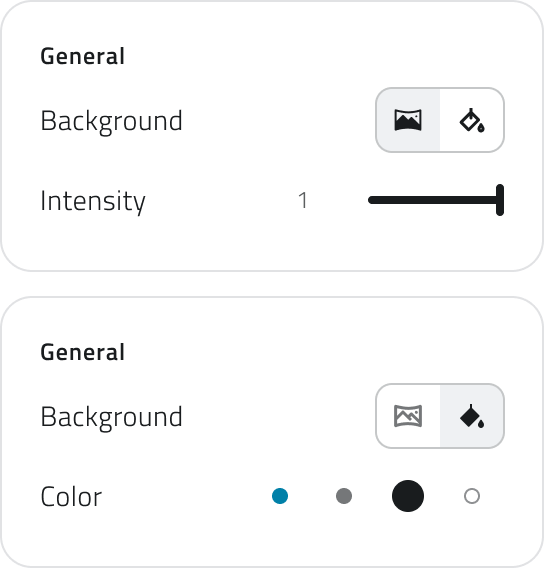
| Parameter | Customisation details |
| Background | Set a panoramic background or a solid colour. |
| Intensity (panoramic background) | Sets the intensity of the background image in a range between 1 and 0 (black). |
| Colour (solid colour) | Choose from 4 background colours. |
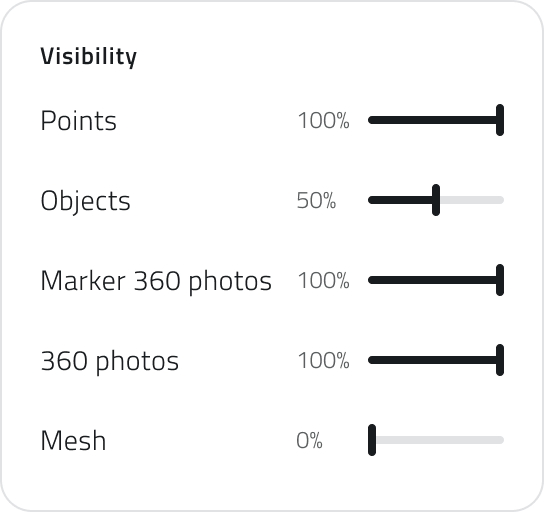
Visibility
Adjusts the transparency percentage for the various elements in the scene.
Grid
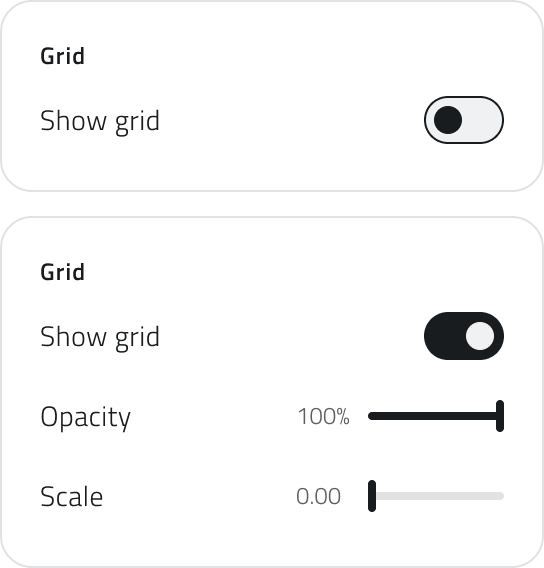
| Function / Parameter | Action |
| Grid visible (Enable/Disable) | Enables or disables the grid display. |
| Opacity | Adjusts the transparency percentage of the grid. |
| Scale | Adjusts the size of the grid. |
Modifying the 3D View Settings
This function, accessible via the Settings icon, allows you to adjust the movement and rotation speed of the 3D view.
At the top there is a Reset button that restores all Settings to their default values.
Speed
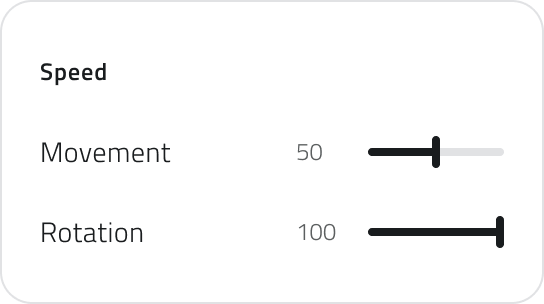
| Parameter | Adjustment range | Purpose |
| Movement | Between 40 and 500. | Adjusts how quickly you move through the scene. |
| Rotation | Between 100 and 500. | Adjusts the speed at which the 3D view rotates. |
Links
![]() Italian version
Italian version
Le funzioni di Stile e Impostazioni ti permettono di personalizzare l'aspetto visivo, l'orientamento e la dinamica di navigazione della scena tridimensionale. Entrambe sono accessibili dalla barra degli strumenti passando con il mouse sulla vista 3D.
Modificare lo Stile della Vista 3D
La funzione Stile (icona del secchiello) permette di regolare i colori dei punti, lo sfondo, la visibilità degli elementi e i parametri della griglia di sfondo.
![]()
In alto è presente il pulsante di Reset, che riporta tutte le voci dello Stile ai valori di default.
Punti
Applicabile solo in presenza di nuvole di punti.
| Parametro | Dettagli di Personalizzazione |
| Colore | Varie modalità disponibili (es. RGB, Profondità, Elevazione, Intensità, Normale, Composto). |
| Dimensione | Regolabile tra 1 e 10 pixel. |
| Forma | Scegli tra cerchi e quadrati. |
Generale
| Parametro | Dettagli di Personalizzazione |
| Sfondo | Imposta uno sfondo panoramico o una tinta unita. |
| Intensità (sfondo panoramico) | Imposta l'intensità dell'immagine di sfondo in un range tra 1 e 0 (nero). |
| Colore (tinta unita) | Scegli tra 4 colori di sfondo. |
Visibilità
Regola la percentuale di trasparenza per i vari elementi della scena.
Griglia
| Funzione / Parametro | Azione |
| Griglia visibile (Attiva/Disattiva) | Attiva o disattiva la visualizzazione della griglia. |
| Opacità | Regola la percentuale di trasparenza della griglia. |
| Scala | Regola la dimensione della griglia. |
Modificare le Impostazioni della Vista 3D
Questa funzione, accessibile tramite l'icona Impostazioni, ti permette di regolare la velocità di movimento e rotazione della visuale 3D.
In alto è presente il pulsante di Reset, che riporta tutte le voci delle Impostazioni ai valori di default.
Velocità
| Parametro | Intervallo di Regolazione | Scopo |
| Movimento | Tra 40 e 500. | Regola quanto rapidamente ci si muove nella scena. |
| Rotazione | Tra 100 e 500. | Regola la velocità con cui ruota la visuale 3D. |
Collegamenti
Last update: 21 May 2026
Import shape files
![]() English version
English version
The Upload Shape tool allows you to import geographic data in Shapefile format and automatically create new objects within an object class in the project.
During the import, the geometries in the shapefile are converted into objects of the selected object class and the attributes are filled in using the values present in the file.
Preparing the Shapefile
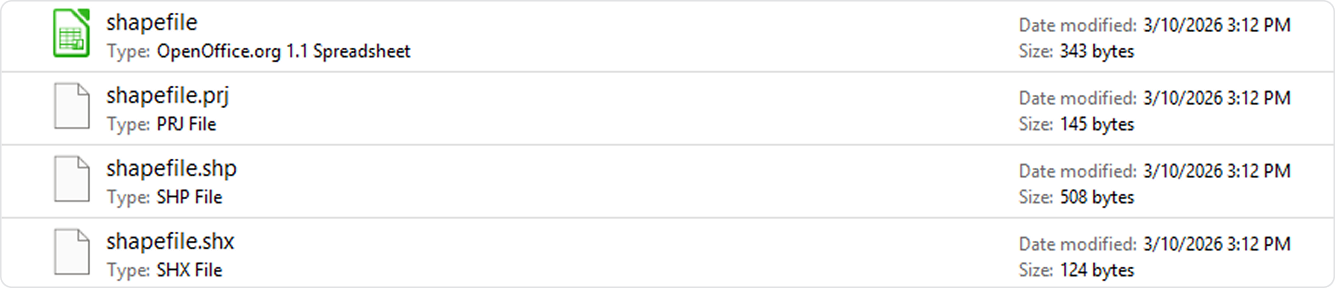
The file must be uploaded in ZIP format and must contain the main shapefile components:
.shp.dbf.shx.prj
All files must have the same name.
The maximum ZIP file size is 10 MB.
Only one Shape file can be uploaded at a time.
Each upload allows you to create objects for one object class only.
Importing a Shapefile
To import a shapefile:
1) Open the Tools section of the project.
2) Click the Upload Shape button.
3) Select the ZIP file containing the shapefile.
4) Select the object class to import the data into and click the Validate button to verify that the uploaded file meets the necessary requirements.
During this phase the system automatically performs some checks.
In particular it verifies that:
- the geometry type of the shapefile is compatible with the selected object class
- the shapefile contains sufficient attributes to fill in the mandatory ones of the object class
If the checks are passed, you can proceed with the import configuration.
Coordinate systems
The platform is compatible with the following coordinate systems:
| EPSG code | Name | Type |
| EPSG:4326 | WGS 84 | Geographic |
| EPSG:3857 | Web Mercator | Projected |
| EPSG:3003 | Monte Mario / Italy zone 1 (Gauss-Boaga Ovest) | Projected |
| EPSG:3004 | Monte Mario / Italy zone 2 (Gauss-Boaga Est) | Projected |
| EPSG:6707 | RDN2008 / Italy zone (E-N) — TM32 | Projected |
| EPSG:6708 | RDN2008 / Italy zone (E-N) — TM33 | Projected |
| EPSG:25832 | ETRS89 / UTM zone 32N | Projected |
| EPSG:25833 | ETRS89 / UTM zone 33N | Projected |
| EPSG:32632 | WGS 84 / UTM zone 32N | Projected |
| EPSG:32633 | WGS 84 / UTM zone 33N | Projected |
| EPSG:23032 | ED50 / UTM zone 32N | Projected |
| EPSG:23033 | ED50 / UTM zone 33N | Projected |
| EPSG:28992 | Amersfoort / RD New (Netherlands) | Projected |
| EPSG:27700 | OSGB36 / British National Grid | Projected |
| EPSG:2154 | RGF93 / Lambert-93 | Projected |
| EPSG:4258 | ETRS89 (geographic) | Geographic |
| EPSG:4269 | NAD83 (geographic) | Geographic |
| EPSG:4267 | NAD27 (geographic) | Geographic |
| EPSG:4230 | ED50 (geographic) | Geographic |
Mapping shapefile attributes
After the file has been validated, a screen is displayed that allows you to manually configure the attribute mappings. The system automatically suggests an initial match between the attributes in the shapefile and those of the object class.
The screen is organised in two columns:
- left: attributes present in the shapefile
- right: attributes of the object class
For each attribute of the object class you can select which shapefile attribute to use.
During configuration, some visual indicators are shown to help complete the mapping correctly.
In particular:
- Mandatory attributes of the selected object class that have not yet been filled in are highlighted in red.
- Shapefile attributes that have already been used are shown as linked and highlighted in green.
- A counter shows how many shapefile attributes have not yet been mapped.
Only attributes of the same type can be mapped together.
If a shapefile attribute is reused, the previous mapping is automatically removed.
Starting the import
When you confirm the import by clicking Import, the system starts the upload process.
During this phase:
- The object class instances are created automatically
- Geometries are imported from the shapefile
- Attribute values are filled in according to the configured mappings
Leaving the project or refreshing the browser page will interrupt all ongoing uploads.
Monitoring the import status
In the page header, the Upload menu is available, which allows you to monitor the status, the import progress of shapefiles and the outcome of the last completed operation.
Information about the last upload remains visible for 4 hours from the start of the import.
![]()
Only one Shape file can be uploaded at a time.
If necessary, the ongoing upload can be cancelled using the Cancel button.
Import completed
At the end of the import, the shapefile geometries are created in the selected object class. If some geometries are invalid or incomplete, they may not be imported.
The upload card shows the number of geometries created relative to the total present in the file.
Once the operation is complete, you can always download the import report, which contains a summary of the processed elements and any issues encountered.
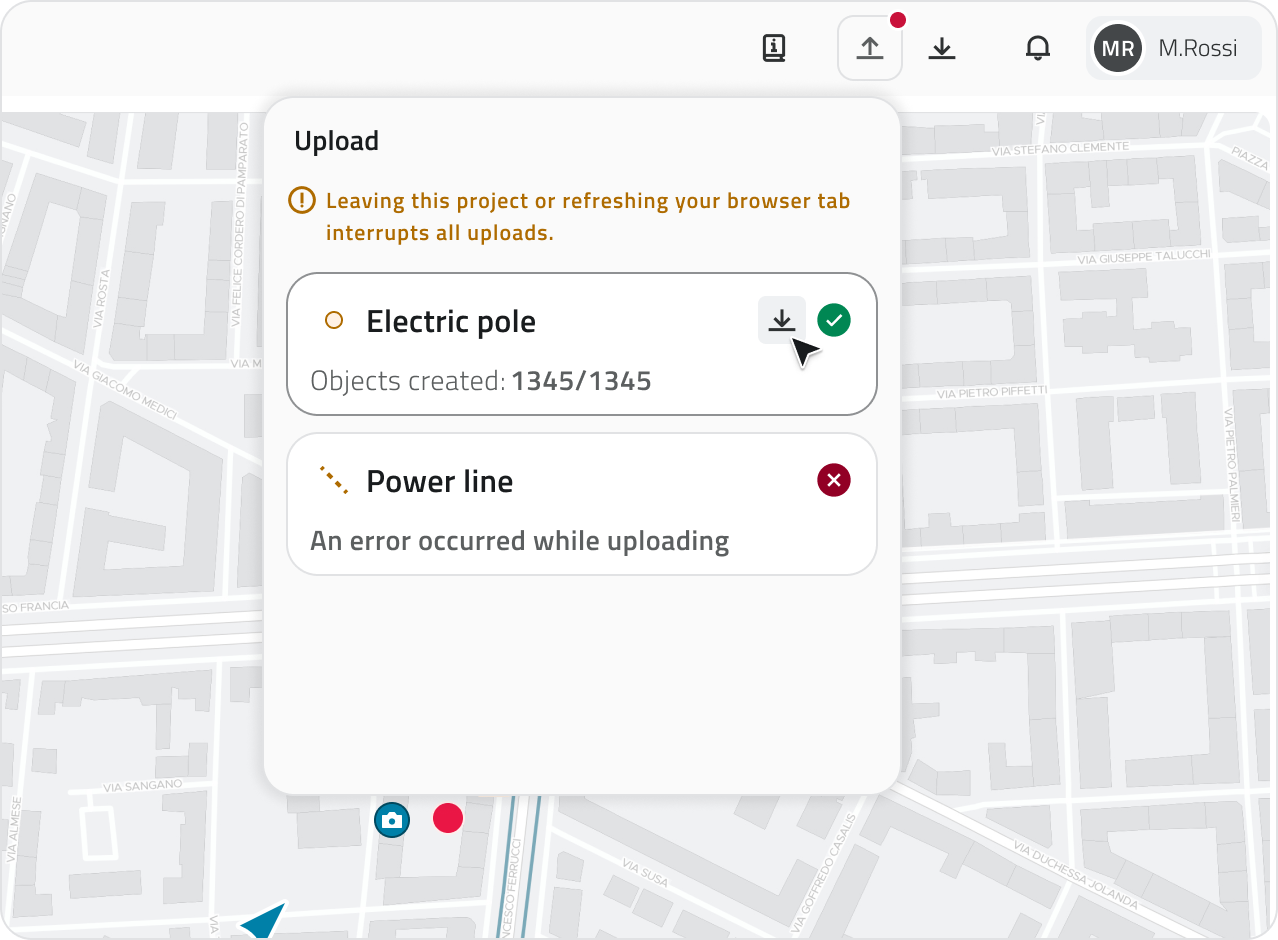
💡 Tip: Use the report to check for any issues: if the import is partial, the report allows you to identify the geometries that were not imported.
Links
![]() Italian version
Italian version
Lo strumento Upload Shape permette di importare dati geografici in formato Shapefile e creare automaticamente nuovi oggetti all’interno di una classe oggetto del progetto.
Durante l’importazione, le geometrie presenti nello shapefile vengono convertite in oggetti della classe oggetto selezionata e gli attributi vengono compilati utilizzando i valori presenti nel file.
Preparare il file Shapefile
Il file deve essere caricato in formato ZIP e deve contenere i principali componenti dello shapefile:
.shp.dbf.shx.prj
Tutti i file devono avere lo stesso nome.
La dimensione massima del file ZIP è 10 MB.
È possibile caricare un solo file Shape alla volta.
Ogni caricamento permette di creare oggetti per una sola classe oggetto.
Importare uno Shapefile
Per importare uno shapefile:
1) Apri la sezione Strumenti del progetto.
![]()
2) Clicca sul pulsante Carica Shape.

3) Seleziona il file ZIP contenente lo shapefile.
4) Seleziona la classe oggetto in cui importare i dati e clicca sul pulsante Valida per verificare che il file caricato rispetti i requisiti necessari.

Durante questa fase il sistema esegue automaticamente alcune verifiche.
In particolare controlla che:
- il tipo di geometria dello shapefile sia compatibile con la classe oggetto selezionata
- lo shapefile contenga attributi sufficienti per compilare quelli obbligatori della classe oggetto
Se i controlli sono superati è possibile continuare con la configurazione dell’importazione.
Sistemi di coordinate
La piattaforma è compatibile con i seguenti sistemi di coordinate:
|
Codice EPSG |
Nome |
Tipo |
|
EPSG:4326 |
WGS 84 |
Geografico |
|
EPSG:3857 |
Web Mercator |
Proiettato |
|
EPSG:3003 |
Monte Mario / Italy zone 1 (Gauss-Boaga Ovest) |
Proiettato |
|
EPSG:3004 |
Monte Mario / Italy zone 2 (Gauss-Boaga Est) |
Proiettato |
|
EPSG:6707 |
RDN2008 / Italy zone (E-N) — TM32 |
Proiettato |
|
EPSG:6708 |
RDN2008 / Italy zone (E-N) — TM33 |
Proiettato |
|
EPSG:25832 |
ETRS89 / UTM zone 32N |
Proiettato |
|
EPSG:25833 |
ETRS89 / UTM zone 33N |
Proiettato |
|
EPSG:32632 |
WGS 84 / UTM zone 32N |
Proiettato |
|
EPSG:32633 |
WGS 84 / UTM zone 33N |
Proiettato |
|
EPSG:23032 |
ED50 / UTM zone 32N |
Proiettato |
|
EPSG:23033 |
ED50 / UTM zone 33N |
Proiettato |
|
EPSG:28992 |
Amersfoort / RD New (Netherlands) |
Proiettato |
|
EPSG:27700 |
OSGB36 / British National Grid |
Proiettato |
|
EPSG:2154 |
RGF93 / Lambert-93 |
Proiettato |
|
EPSG:4258 |
ETRS89 (geographic) |
Geografico |
|
EPSG:4269 |
NAD83 (geographic) |
Geografico |
|
EPSG:4267 |
NAD27 (geographic) |
Geografico |
|
EPSG:4230 |
ED50 (geographic) |
Geografico |
Associare gli attributi dello shapefile
Dopo la verifica del file, viene visualizzata una schermata che consente di configurare manualmente le associazioni tra gli attributi. Il sistema propone automaticamente una prima corrispondenza tra gli attributi presenti nello shapefile e quelli della classe oggetto.
La schermata è organizzata in due colonne:
- sinistra: attributi presenti nello shapefile
- destra: attributi della classe oggetto

Per ogni attributo della classe oggetto puoi selezionare quale attributo dello shapefile utilizzare.
Durante la configurazione vengono mostrati alcuni indicatori visivi che aiutano a completare correttamente l’associazione.
In particolare:
- Gli attributi obbligatori della classe oggetto selezionata che non sono ancora compilati vengono evidenziati in rosso.
- Gli attributi dello shapefile già utilizzati risultano collegati e vengono evidenziati in verde.
- Un contatore indica quanti attributi dello shapefile non sono ancora associati.
È possibile associare solo attributi dello stesso tipo.
Se un attributo dello shapefile viene riutilizzato, l’associazione precedente viene automaticamente rimossa.
Il pulsante Importa diventa disponibile solo quando tutti gli attributi obbligatori sono stati associati.
Avviare l’importazione
Quando confermi l’importazione cliccando su Importa, il sistema avvia il processo di caricamento.
Durante questa fase:
- Vengono create automaticamente le istanze della classe oggetto
- Le geometrie vengono importate dallo shapefile
- I valori degli attributi vengono compilati secondo le associazioni configurate
Lasciare il progetto o aggiornare la pagina del browser, comporta l'interruzione di tutti i caricamenti.
Monitorare lo stato dell’importazione
Nell'intestazione della pagina è disponibile il menu dell' Upload, che consente di monitorare lo stato, il progresso di importazione degli shapefile e l’esito dell’ultima operazione completata.
Le informazioni relative all’ultimo upload restano visibili per 4 ore dall'avvio dell'importazione.
![]()
È possibile caricare un solo file Shape alla volta.
Se necessario, il caricamento in corso può essere annullato tramite il pulsante Cancella.
Importazione completata
Al termine dell’importazione le geometrie dello shapefile vengono create nella classe oggetto selezionata. Se alcune geometrie risultano non valide o incomplete, potrebbero non essere importate.
La card dell’upload mostra il numero di geometrie create rispetto al totale presente nel file.
Al termine dell’operazione è sempre possibile scaricare il report dell’importazione, che contiene il riepilogo degli elementi elaborati e di eventuali problemi riscontrati.
💡Suggerimento: Usa il report per verificare eventuali problemi: se l'importazione è parziale, ti permette di identificare le geometrie che non sono state importate.
Collegamenti
Last update: 22 May 2026
Managing reports in the project
![]() English version
English version
This section explains how to generate, view and manage reports within the project. Reports are produced from predefined templates and can be downloaded in the available formats.
Generating and deleting reports is only available if you have edit permissions for that template.
Generating a report
1. From the left-side menu, click the Report icon (file-shaped icon) to open the dedicated section.
![]()
2. Select the desired template from the list to open the Report view.
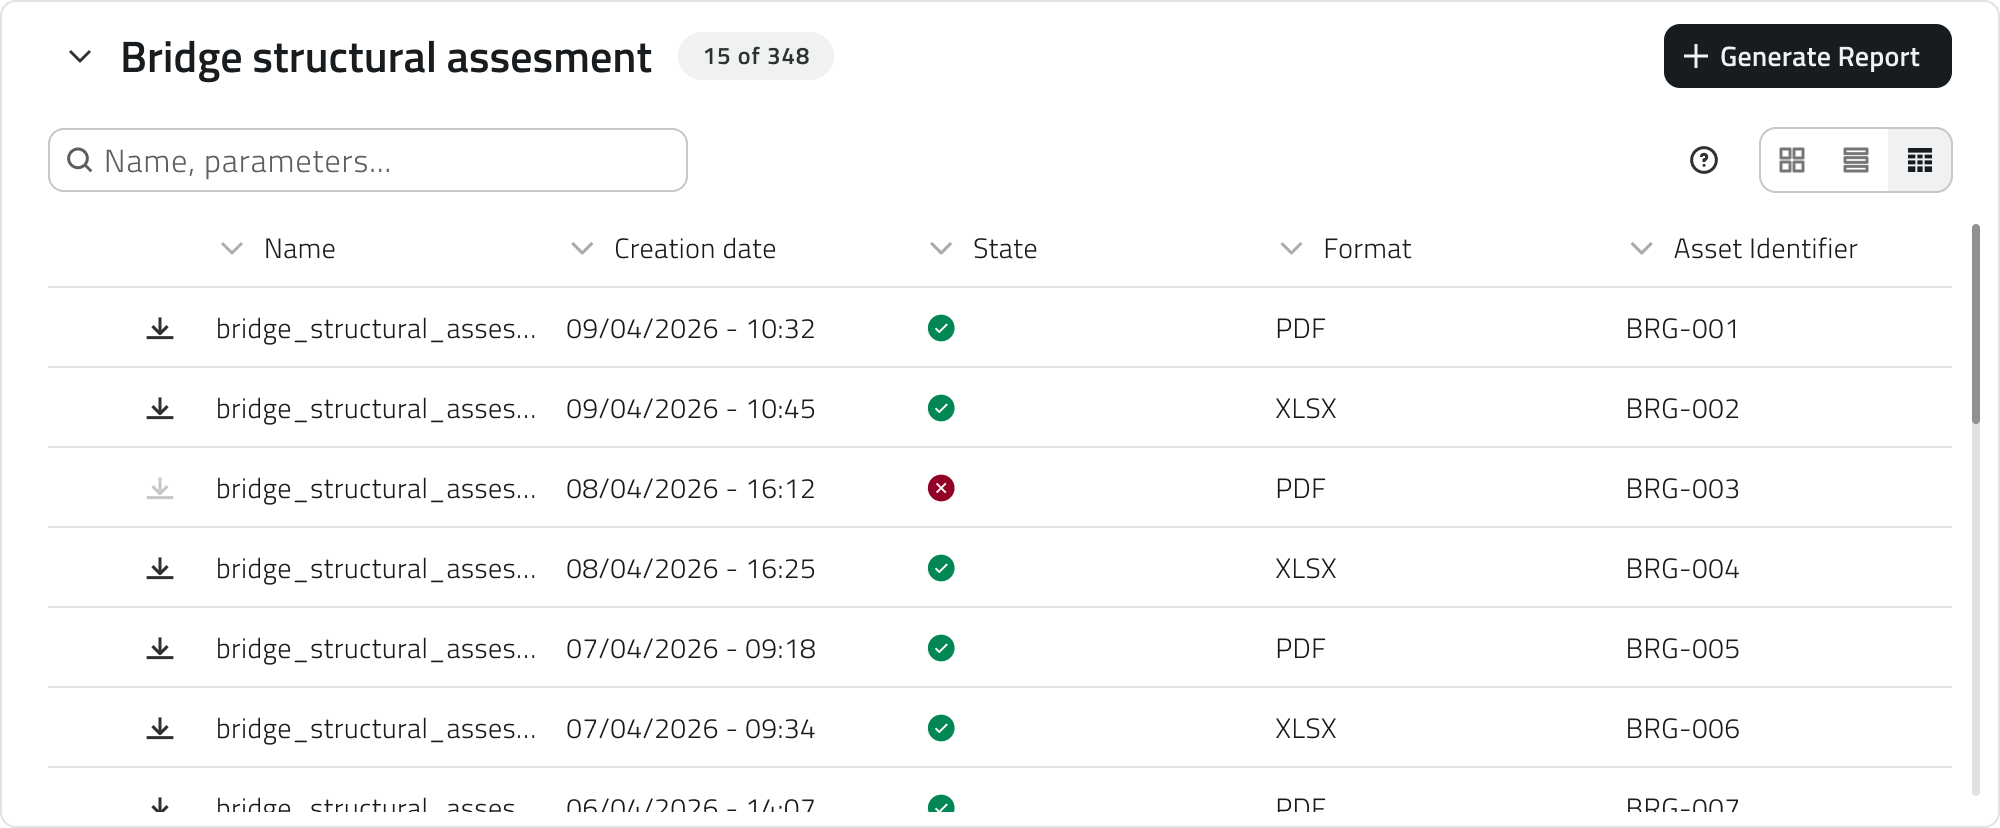
3. Click the Generate report button in the top-right corner.
4. A configuration window opens requiring:
- the selection of a format from those available, configured in the Backoffice;
- the completion of any filters, which vary depending on the selected template and refine the report content.
Some filters may be mandatory.
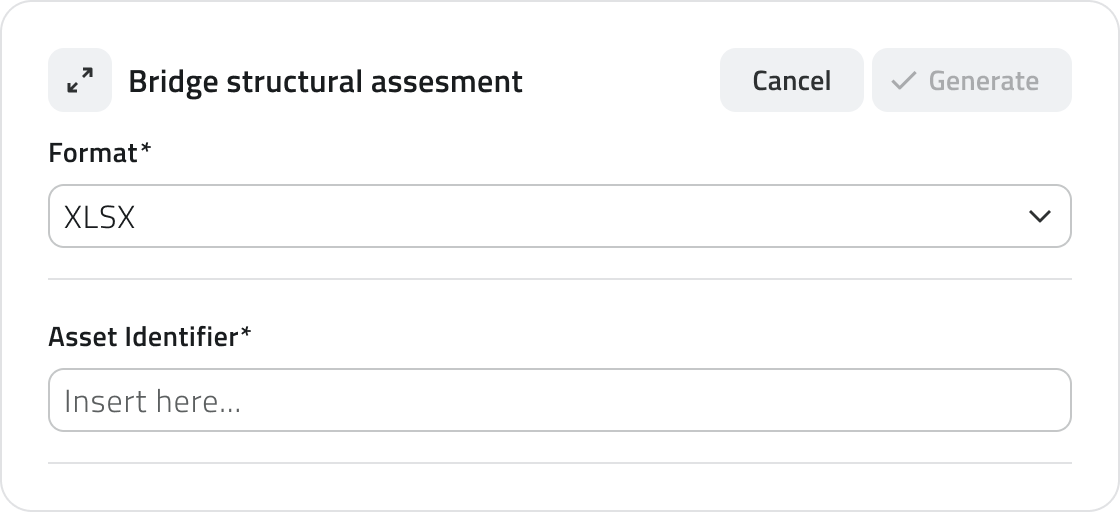
5. Click Confirm to start the generation, or Cancel to close the window without proceeding.
Report generation takes a few moments. Do not leave the page during the process. The progress status is visible directly in the report row, where the download button shows a spinner until completion.
Report information
Once generation has started, the following information is shown for each element in the Report view:
- Name of the report
- Creation date (empty until generation is complete)
- Status (success or error; empty if generation has not yet concluded)
- Selected format
- Filters entered during configuration
Downloading and viewing a report
Once generation is complete, the report can be downloaded using the download button on the element row. Alternatively, clicking the blue Open button that appears when hovering over the element opens the report details, which shows all associated information.
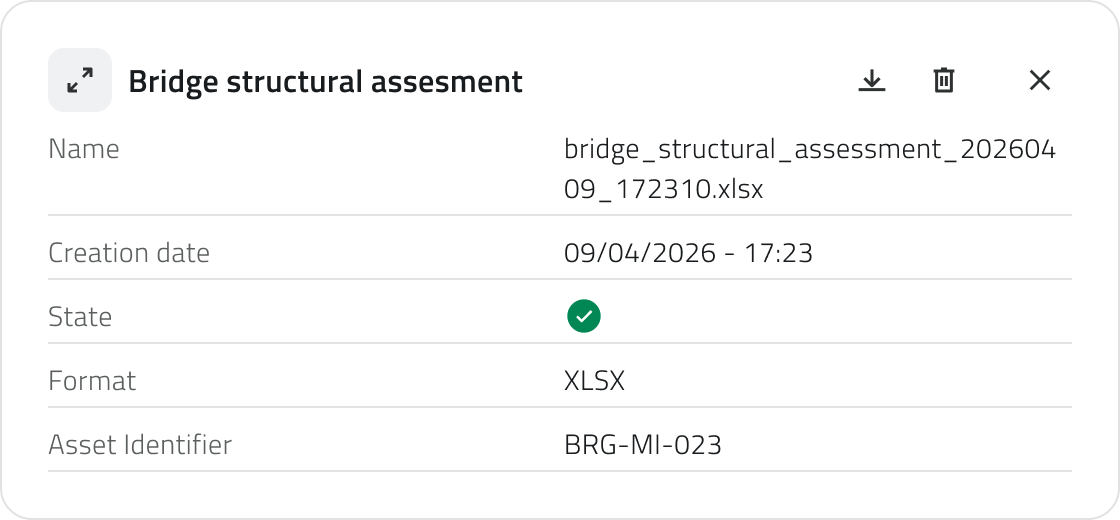
If generation did not complete successfully, the error message is visible at the top of the report details.
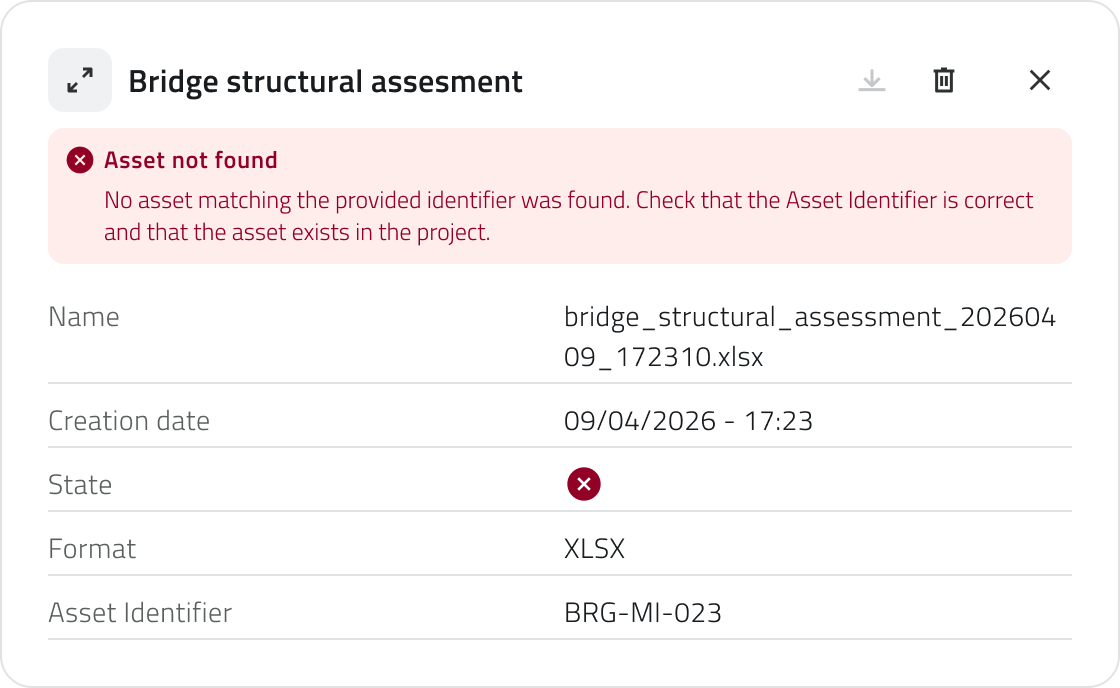
Reports cannot be edited after generation.
Deleting a report
To delete a report, open the report details and click the Delete button, then confirm the operation. Alternatively, select one or more reports from the list: the Delete button will appear in the top-right corner of the view.
Links
![]() Italian version
Italian version
Questa sezione spiega come generare, consultare e gestire i report all'interno del progetto. I report vengono prodotti a partire da template predefiniti e possono essere scaricati nei formati disponibili.
La generazione e l'eliminazione dei report sono disponibili solo se si dispone dei permessi di modifica per quel template.
Generare un report
![]()
2. Seleziona il template desiderato dalla lista per aprire la vista Report.
3. Clicca sul pulsante Genera report in alto a destra.
4. Si apre una finestra di configurazione che richiede:
- la scelta di un formato tra quelli disponibili, configurati nel Backoffice;
- la compilazione degli eventuali filtri, che variano in base al template selezionato e affinano il contenuto del report.
Alcuni filtri possono essere obbligatori.
5. Clicca Conferma per avviare la generazione, oppure Annulla per chiudere la finestra senza procedere.
Il pulsante Conferma è disabilitato finché tutti i filtri obbligatori non sono stati compilati.
La generazione del report richiede alcuni istanti. Non lasciare la pagina durante il processo.
Lo stato di avanzamento è visibile direttamente nella riga del report, dove il pulsante di download mostra uno spinner fino al completamento.
Informazioni del report
Una volta avviata la generazione, nella vista Report vengono mostrate le seguenti informazioni per ogni elemento:
- Nome del report
- Data di creazione (vuota fino al completamento della generazione)
- Stato (successo o errore; vuoto se la generazione non è ancora conclusa)
- Formato selezionato
- Filtri inseriti in fase di configurazione
Scaricare e consultare un report
Al termine della generazione il report può essere scaricato tramite il pulsante di download presente sulla riga dell'elemento. In alternativa, cliccando sul pulsante blu Apri che compare al passaggio del mouse sull'elemento si apre il dettaglio report, che mostra tutte le informazioni associate.
Se la generazione non è andata a buon fine, il messaggio di errore è visibile in cima al dettaglio del report.
I report non possono essere modificati dopo la generazione.
Eliminare un report
Per eliminare un report apri il dettaglio report e clicca il pulsante Elimina, quindi conferma l'operazione. In alternativa, seleziona uno o più report dalla lista: comparirà il pulsante Elimina in alto a destra della vista.
Collegamenti
Last update: 11 June 2026